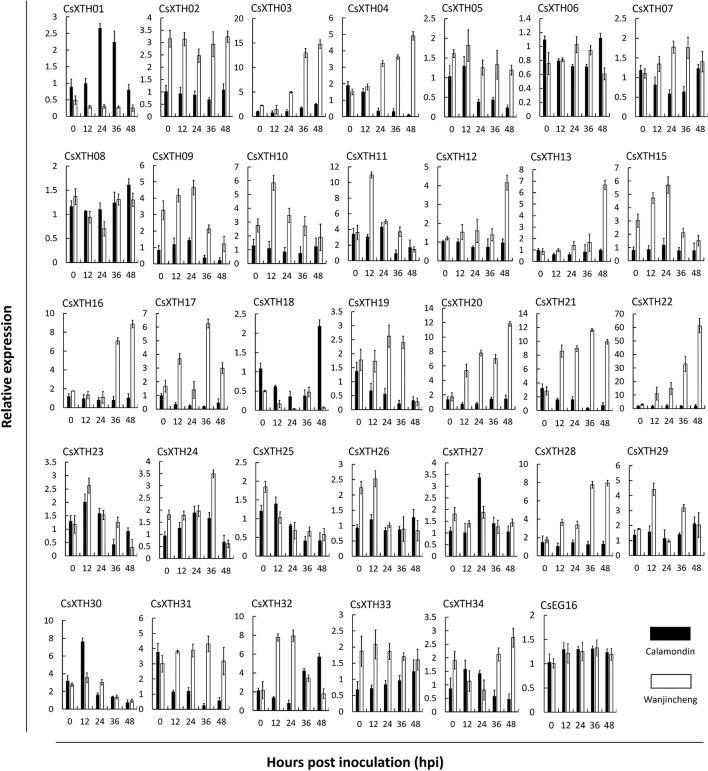
Figure 3.
Differential expression profiles of CsXTHs induced by Xcc. Samples for expression profiling were collected from Wanjincheng (empty bars) and calamondin (solid bars) at 0, 12, 24, 36, and 48 h post inoculation (hpi) of Xcc. Expression profiles were detected by qRT–PCR and normalized to CsActin. Control samples were inoculated with LB medium. Note that the relative expression of CsXTHs was on a different scale. LB, lysogeny broth; qRT–PCR, quantitative reverse transcriptase–polymerase chain reaction; Xcc, Xanthomonas citri subsp. citri.

