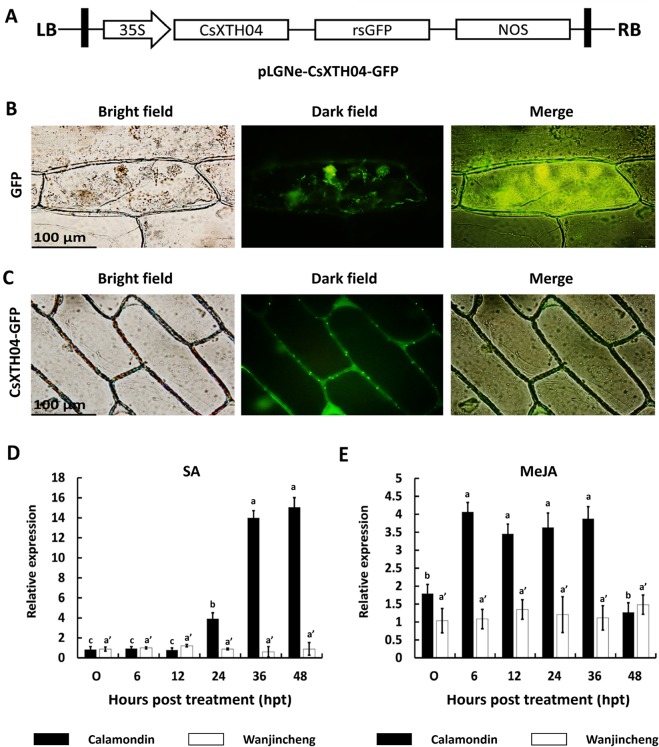
Figure 4.
Subcellular localization and SA/MeJA inducible expression profiles of CsXTH04. (A) Structure of the transient expression plasmid (pLGNe-CsXTH04-GFP). LB, left border; RB, right border; 35S, CaMV35S promoter; NOS: terminator. (B) Transient expression of GFP. (C) Transient expression of CsXTH04-GFP. Each field of view is displayed as a bright field, dark field, and merged image. Expression of CsXTH04 induced by SA (D) and MeJA (E) was measured by qRT–PCR and normalized to CsActin. Samples were collected at 0, 6, 12, 24, 36, and 48 hpt with SA and MeJA. In (B) and (C), scale bars = 100 μm. In (D) and (E), solid bars represent calamondin, while empty bars represent Wanjincheng. Results were analyzed via Tukey’s honestly significant differences (P = 0.05) in three biological replicates. Each value represents the mean ± SD. For (D) a = 0.213, b = 1.000, c = 0.979, a' = 0.597. (C) a = 0.702, b = 0.380, a' = 0.845. GFP, green fluorescent protein; MeJA, methyl jasmonate; qRT–PCR, quantitative reverse transcriptase–polymerase chain reaction; SA, salicylic acid.

