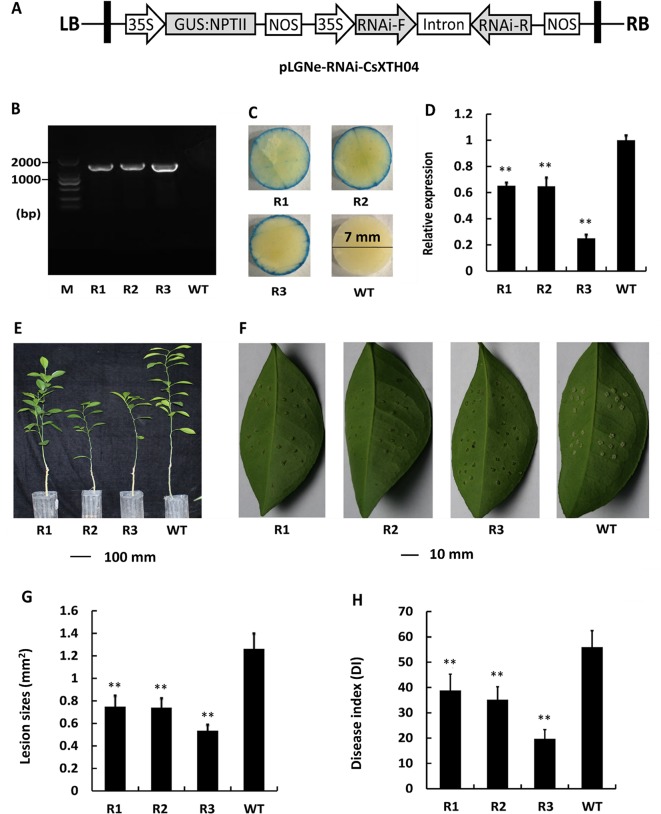
Figure 6.
Characterization and evaluation of the silencing of transgenic plants in response to Xcc. (A) Plasmid structures for silencing assays by RNAi (pLGNe-RNAi-CsXTH04). LB, left border; RB, right border; 35S, CaMV35S promoter; NOS, terminator. (B) Validation of transgenic plants by PCR. (C) Validation of transgenic plants by GUS staining (leaf disc diameter = 7 mm, staining period = 24 h). (D) Expression of CsXTH04 detected by qRT–PCR. (E) Phenotypes of transgenic and WT plants. (F) Disease symptoms on the leaves of silenced transgenic plants and WT plants inoculated by Xcc. Sampling and imaging at 10 dpi. Lesion sizes (LSs) (G) and disease index (DI) (H) of each transgenic plant were assessed to evaluate disease resistance. In (D), (G), and (H), **P < 0.01, Student’s t-test. Each value represents the mean ± SD. In (B) to (H), R1–R3 indicate silencing plants; WT, wild type. In (B), M indicates DNA marker. qRT–PCR, quantitative reverse transcriptase–polymerase chain reaction; Xcc, Xanthomonas citri subsp. citri.

