
FIGURE 2.
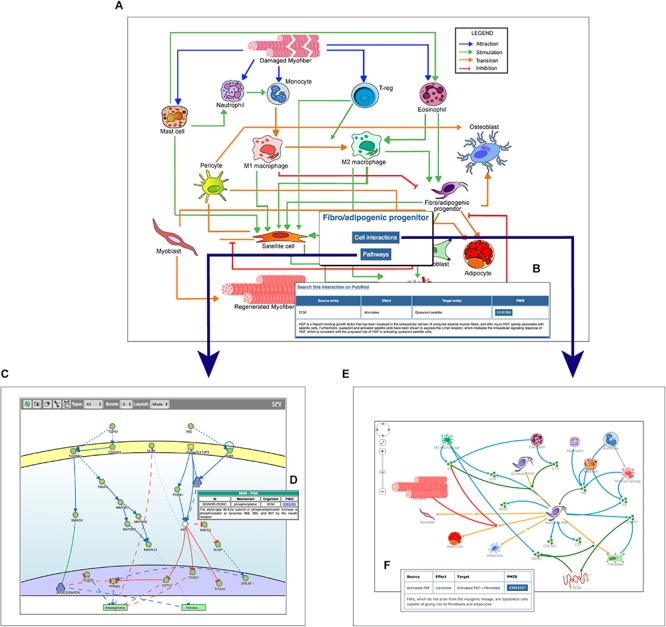
Navigating the Myo-REG resource. (A) In the homepage a network of the cell interactions occurring in muscle regeneration is the main entry point to the information annotated in Myo-REG. By clicking on any edges, a pop-up window is displayed (B) showing the annotation for the selected interaction. By clicking a cell icon, a pop-up window is displayed offering the possibility to select either the “Cell interactions” or the “Pathways” tabs. (C) By selecting the pathway tab the user can choose to display a network representation of the pathways that are relevant for that cell type. (D) The annotation of an interaction (e.g., INSR-PI3K) displayed after clicking the edge on the graph. (E) The cell–cell interactions graph displayed for a selected cell type (FAP). (F) The annotation of an interaction displayed after clicking on an edge of the graph. Edge colors represent distinct interaction types according to the legend displayed on the top-left corner of the graph. Icons with three green circles represent cytokines participating in the process of muscle regeneration.