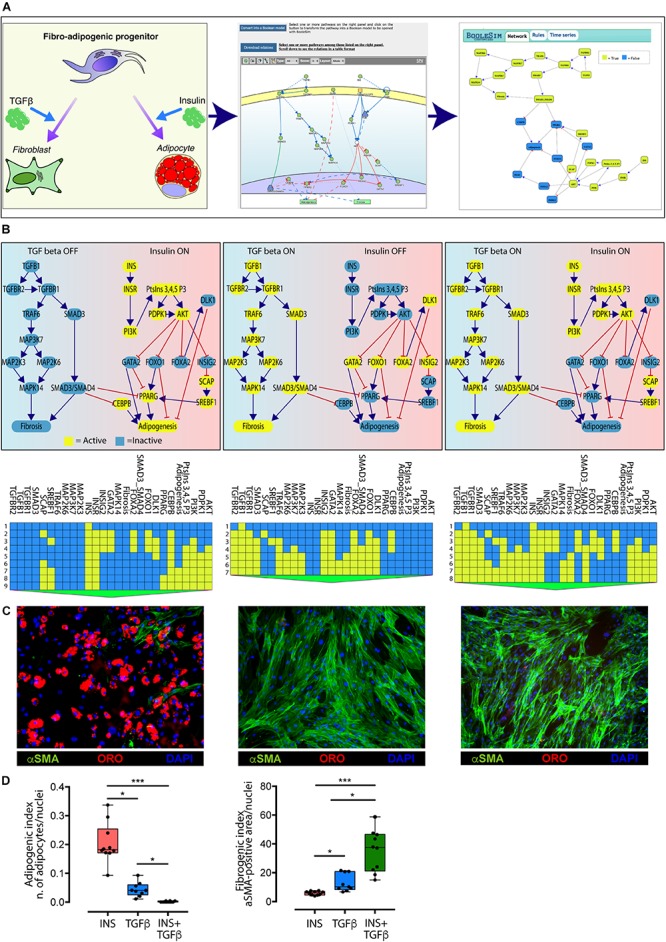
FIGURE 4.

Conversion of the TGFβ and INS pathways into an executable Boolean network. (A) The ability of FAPs to differentiate into either adipocytes or fibroblasts (left panel) is represented in Myo-REG as a union of two selected pathways: INSR and TGFβ (middle panel). Pathways are automatically converted into a Boolean network and input into a customized BooleSim application (right panel). Panel (B) depicts the system stationary phase in conditions in which the FAPs are stimulated with insulin (left panel), TGF beta (middle panel) or both (right panel). The network evolution is represented as a heatmap below each simulation. Yellow means active (True) while blue is inactive (False). (C) Representative immunofluorescence (20× magnification) of FAPs from wild type mice stimulated to differentiate in the presence of insulin (left) (n = 10), TGF beta (middle) (n = 9) or both stimuli (right) (n = 10). Adipocytes (red) and fibroblasts (green) were stained with oil Red O Continued (ORO) and with an anti-α-SMA antibody, respectively. Nuclei (blue) were stained with Hoechst 33342. (D) Left chart: quantification of the percentage of green area with insulin treatment as reference group. Right chart: quantification of the number of adipocytes normalized over the number of nuclei per field (insulin treatment as reference group). The statistical significance was defined as: ∗p < 0.05, ∗∗p < 0.01, and ∗∗∗p < 0.001.
