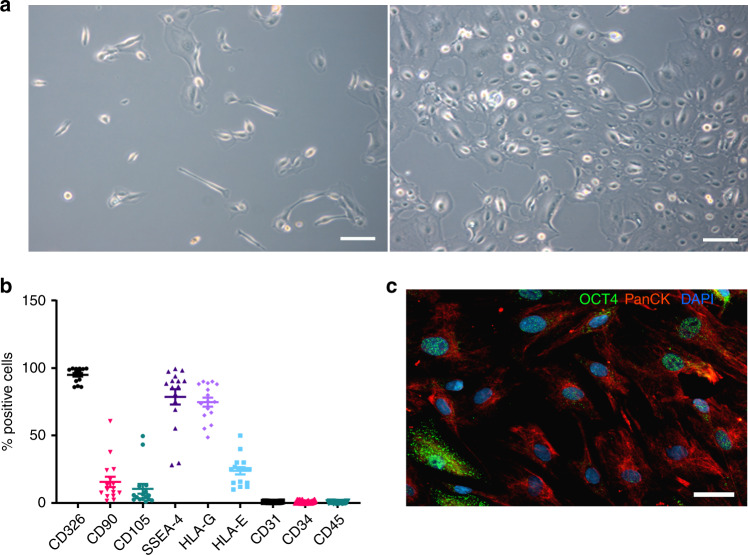
Fig. 1.
Characterization of hAECs. a Phase-contrast microscopic images of cultured hAECs at days 2 (left panel) and 5 (right panel) after seeding. Scale bar = 100 μm. b hAECs were characterized for various surface markers by FACS. Data are the means ± SEM, of cells obtained from sixteen different donors labeled with specific antibodies (% positive cells). c Immunohistochemical detection of cytokeratin (red) and OCT-4 (green) in cultured hAECs; nuclei are labeled by DAPI (blue). Scale bar = 50 μm

