Fig. 3.
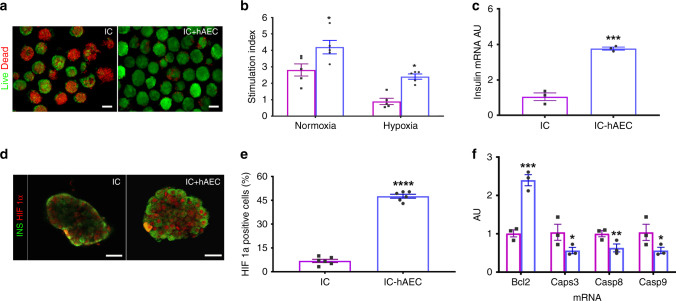
Organoid functionality after hypoxic stress. a Fluorescence views of IC spheroids and IC-hAEC organoids exposed to hypoxia and assessed for viability by a FDA/PI test; green (FDI) and red (PI) signals indicate live and dead cells respectively. Scale bars = 100 μm. b Insulin secretion, expressed as SI, of IC spheroids (magenta columns) and IC-hAEC organoids (blue columns) under normoxic and hypoxic conditions, *p < 0.03 and after hypoxic exposure, *p < 0.02, two-way ANOVA with Sidak’s multiple comparisons test, n = 5. c Insulin mRNA expressed by IC and IC + hAEC spheroids cultured under hypoxic conditions; insulin mRNA was analyzed by qPCR, and data presented as arbitrary units (AU) after normalization to housekeeping genes, ***p < 0.0003, unpaired Student’s t test, n = 3. d, e HIF-1α nuclear localization visualized by immunostaining and its upregulated expression in IC-hAEC spheroids. ****p < 0.0001, unpaired Student’s t test, n = 6. Scale bar = 50 μm. f Casp3, Casp8, Casp9, and Bcl2 mRNAs expressed by IC spheroids spheroids (magenta columns) and IC + hAEC organoids (blue columns) cultured under hypoxic conditions; data presented as arbitrary units (AU) after normalization to housekeeping genes. ***p > 0.0003, **p < 0.0075, *p < 0.02, unpaired Student’s t test, n = 3. All data shown are means ± SEM

