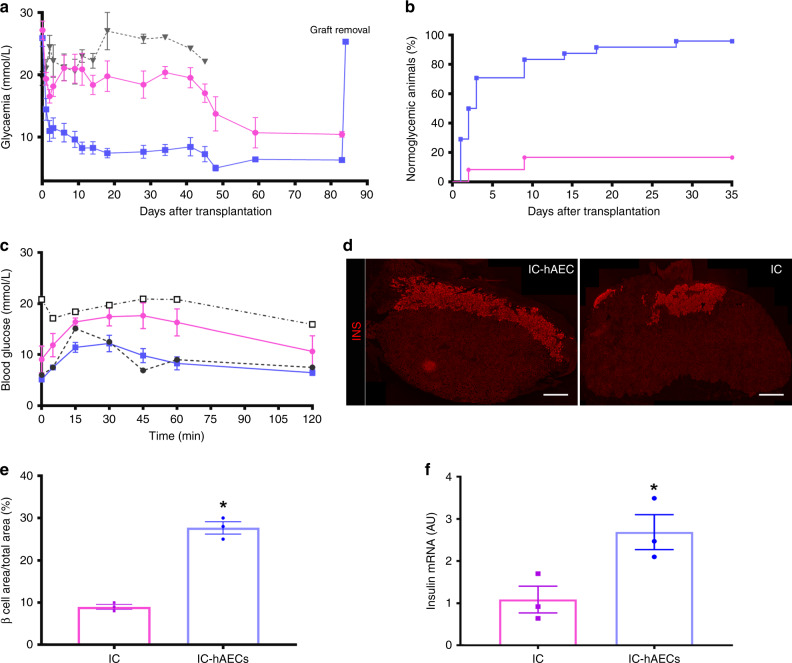
Fig. 4.
In vivo function of islet organoids. a Blood glucose measurements. ****p < 0.0001 IC-hAEC (blue squares, n = 25) vs IC (magenta circles, n = 25), *p IC vs, hAEC (gray triangles, n = 5), ****p < 0.0001 IC-hAEC vs hAEC, one-way ANOVA, with Tukey’s multiple comparison test. b Percentage of cured mice after islet spheroid transplantation. c. Intraperitoneal glucose tolerance tests. **p < 0.01 IC-hAEC (blue squares, n = 10) vs IC (magenta circles, n = 10), one-way ANOVA, with Tukey’s multiple comparison test. Gray squares diabetic non-transplanted controls, gray circles non- diabetic, non-transplanted controls. d, e Insulin-positive area of each group visualized by the immunostaining and its percentage per given area 4 months after transplantation. ****p < 0.0003, unpaired Student’s t test, n = 3. Scale bars = 500 μm. f Rat insulin mRNA levels in retrieved grafts after marginal islet spheroid transplantation. Insulin mRNA was analyzed by qPCR, and data presented as arbitrary units (AU) after normalization to housekeeping genes. *p < 0.01 vs IC group, unpaired Student’s t test, n = 3. All data shown are means ± SEM

