Fig. 7.
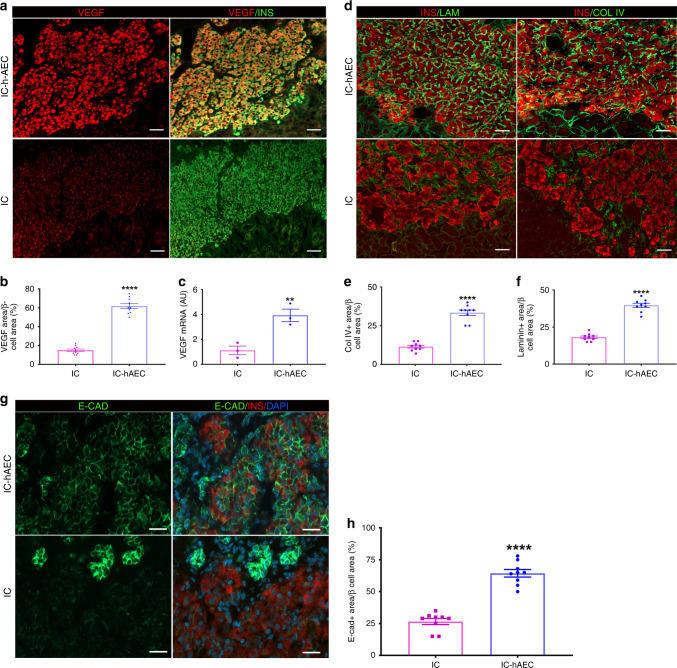
The mechanisms of the enhanced vascularization and improved function of the IC-hAEC grafts. a The graft-bearing kidneys stained for VEGF-A and insulin at day 14 after transplantation. Scale bars = 100 μm. b The mean VEGF-A expression per insulin-positive area, ****p < 0.0001 vs IC group, unpaired Student’s t test, n = 10. c VEGF-A mRNA expressed by IC and IC + hAEC spheroids as analyzed by qPCR, data presented as arbitrary units (AU) after normalization to housekeeping genes, with the IC group set to, **p < 0.001 vs IC group, unpaired Student’s t test, n = 3. d Representative images of the grafts labeled for collagen IV, laminin and insulin. Scale bars = 100 μm. e, f The Col IV-positive and the laminin-positive areas were calculated as a percentage of the graft area, ****p < 0.0001 vs IC group, unpaired Student’s t test, n = 10. g, h Expression of E-cadherin as analyzed by immunohistochemistry in the graft site was considerably upregulated in the IC-hAEC group. Scale bars = 100 μm. ****p < 0.0001 vs IC group, unpaired Student’s t test, n = 10. All data shown are mean ± SEM

