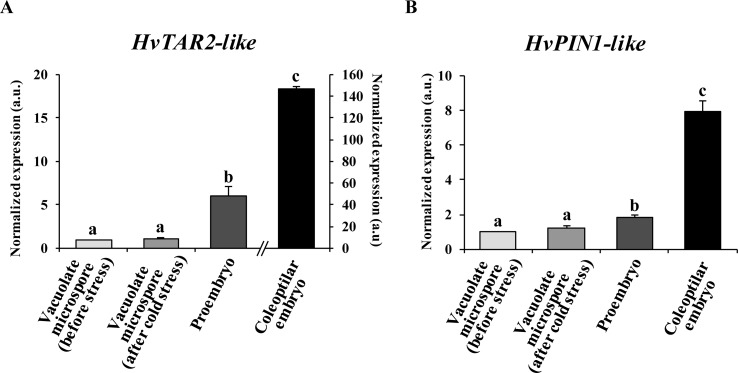
Figure 2.
Gene expression patterns of genes HvTAR2-like (A) and HvPIN1-like (B) during stress-induced microspore embryogenesis. Histograms showing relative changes of mRNA levels at different developmental stages (vacuolated microspores before and after cold stress, proembryos after 4-day culture and coleoptilar embryos after 30-day culture), normalized to vacuolated microspore levels, as determined by RT-qPCR. Each column represents the mean of at least three biological and three technical replicates. Bars indicate the standard error of the mean (SEM). Different letters indicate significant differences among stages according to ANOVA and Tukey tests at P < 0.05.

