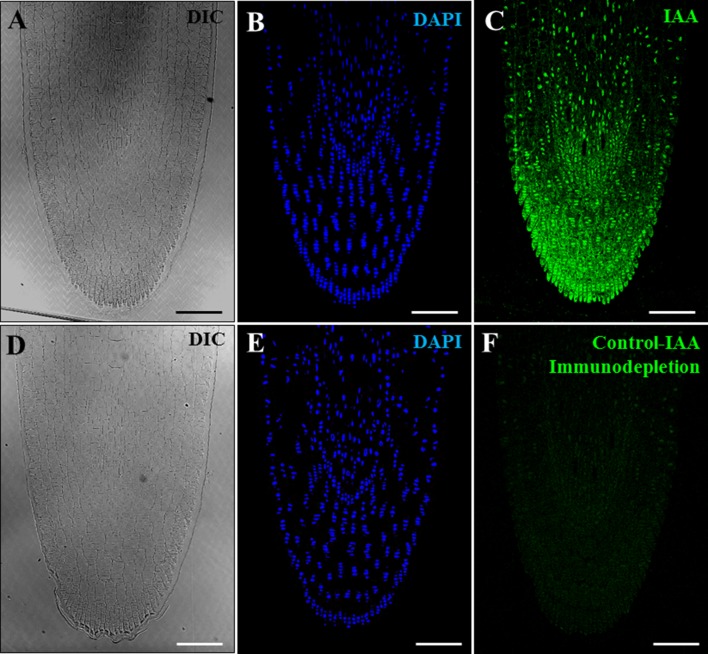
Figure 5.
Positive and negative control experiments of IAA immunofluorescence on growing root tips of barley. Confocal microscopy images of IAA immunofluorescence (green signal). (A–C) Positive control of IAA immunofluorescence on root tips. (D–F) Negative control of IAA immunofluorescence on roots using anti-IAA antibodies preblocked with IAA (immunodepletion). (A, D) Differential interference contrast (DIC). (B, E) DAPI staining of nuclei in blue. (C, F) IAA immunofluorescence in green. Bars represent 100 µm.

