Figure 7.
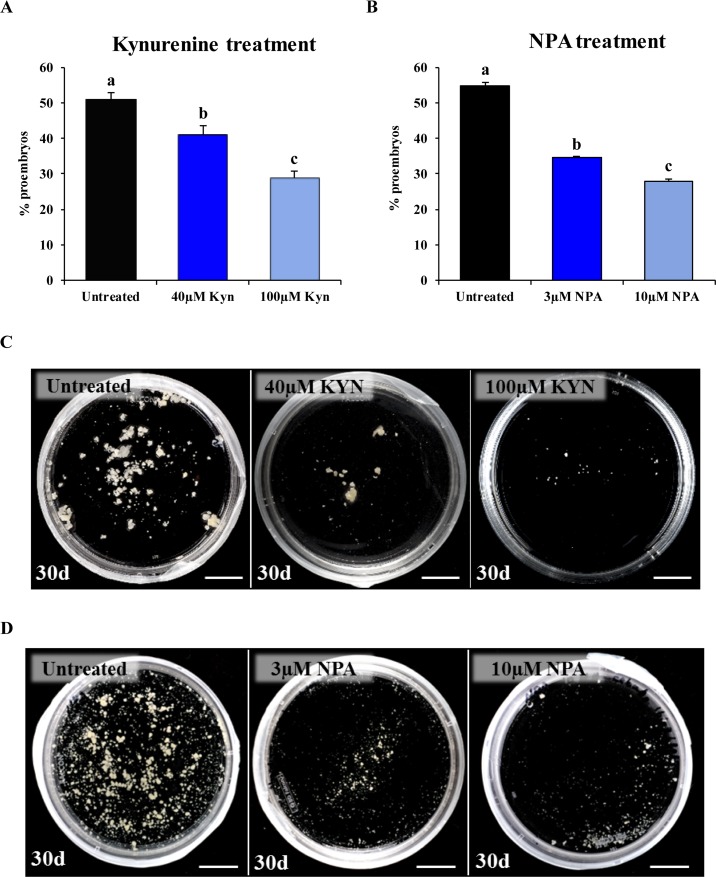
Effect of kynurenine (inhibitor of auxin biosynthesis) and NPA (inhibitor of auxin polar transport) treatments on stress-induced microspore embryogenesis. (A, B) Quantification of microspore embryogenesis initiation, measured as the percentage of proembryos, in untreated cultures and cultures treated with kynurenine (A) and NPA (B) at different concentrations (40 and 100 µM kynurenine, 3 and 10 µM NPA). Histograms show the mean percentage of proembryos after 4 days in untreated (control) and treated cultures. Each column represents the mean of three biological replicates. Bars in columns indicate the SEM; different letters on columns indicate significant differences according to ANOVA and Tukey tests at P < 0.05. (C) Plates showing the microspore-derived embryos produced after 30 days in untreated, 40 µM kynurenine- and 100 µM kynurenine-treated cultures. (D) Plates showing the microspore-derived embryos produced after 30 days in untreated, 3 µM NPA-, and 10 µM NPA-treated cultures. Bars represent: 1 cm.

