
Fig. 1.
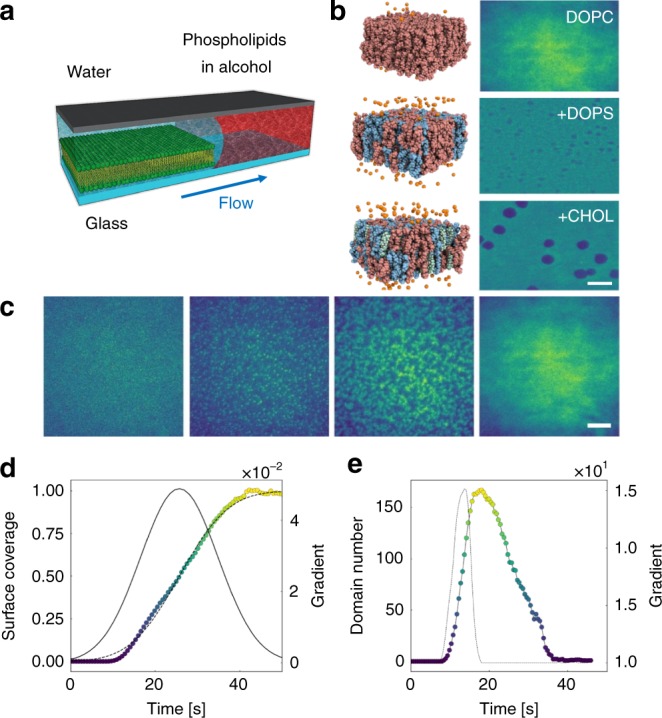
Supported lipid bilayer deposition by solvent exchange in a microfluidic channel. a Schematic of the solvent exchange process to produce single lipid bilayer on a hydrophilic substrate. b Molecular models and the corresponding TIRF results of single lipid bilayers with different components: DOPC, 40:100 DOPS:DOPC and 40:30:100 DOPS:CHOL:DOPC. Scale bar: 10 μm c Representative images of lipid bilayer formation on glass substrate, illustrating a nucleation and growth process. Scale bar: 10 μm. d Plot of surface coverage of DOPC versus time. The data, error function best fit and best fit gradient are shown as the coloured circles, dashed line and solid line, respectively. e Plot of number of DOPC domains versus time and its gradient as a function of time, shown as coloured circles and the dashed line, respectively