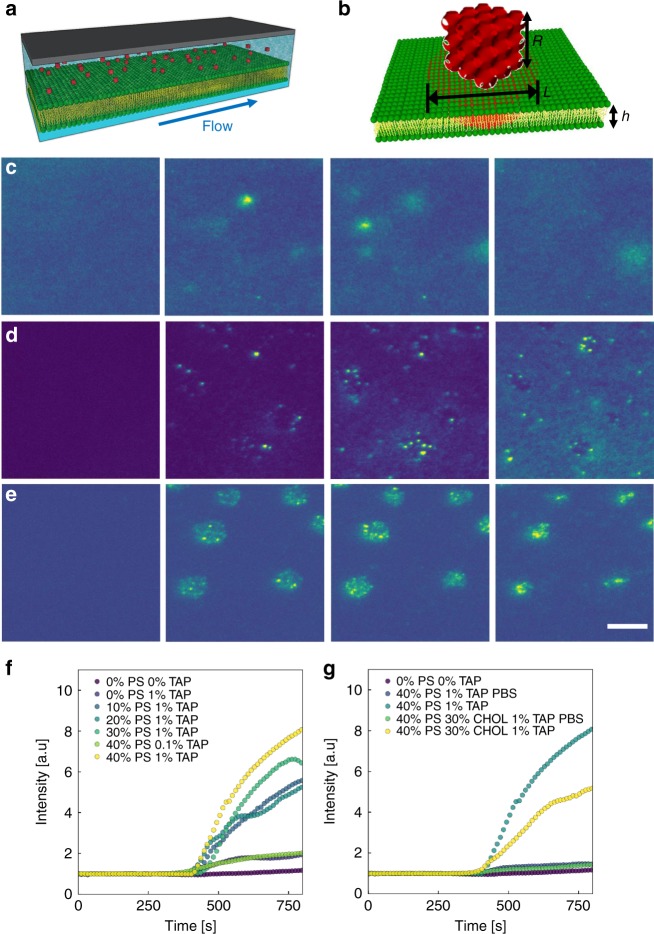
Fig. 2.
Cubosome fusion into lipid bilayer underflow. a Illustration of cubosomes in flow above SLB. b Illustration of single cubosome above SLB. The interacting system is described by the cubosome length R, increasing fluorescent footprint L and bilayer height h. c TIRF snapshots highlight successive fusion events of MO cubosomes with DOPC bilayer. d TIRF snapshots highlight successive fusion events of 1% DOTAP cubosomes with 40% DOPS bilayer. e TIRF snapshots highlight successive fusion events of 1% DOTAP cubosomes with 40% DOPS bilayer in PBS. Scale bar = 5 µm. f The total fluorescence signal recorded for cubosome introductions with various lipid compositions. g The total fluorescence signal recorded for cubosome introductions with various lipid compositions, highlighting impact of PBS environment

