Fig. 7.
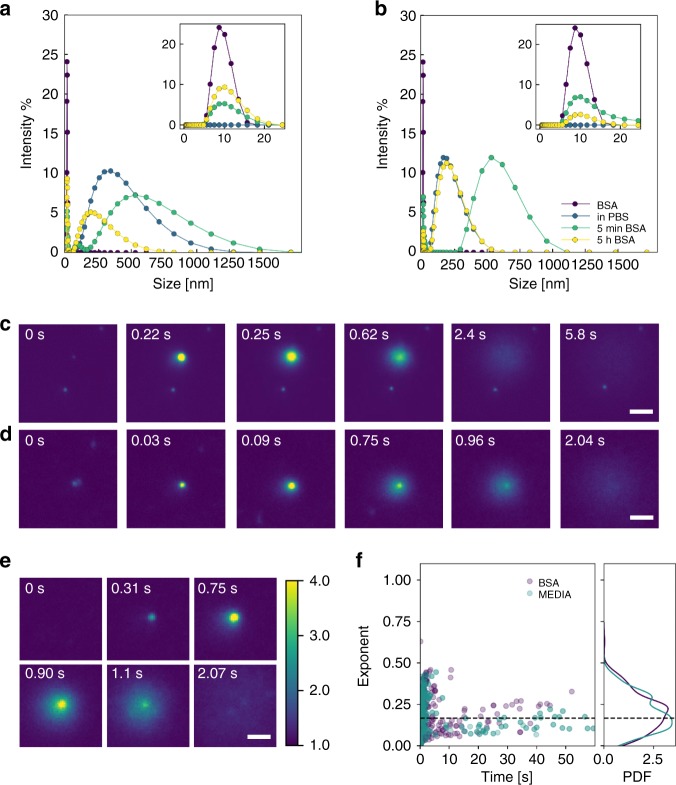
Protein corona influence on cubosome–bilayer interactions. a DLS measurements on MO cubosomes in BSA. b DLS measurements on 1% DOTAP cubosomes in BSA. The results for pure BSA in PBS, cubosome in PBS, cubosome in BSA–PBS for 5 min and for 5 h are shown as the purple, blue green and yellow circles, respectively. c TIRF snapshots of a single MO cubosome with DOPC in BSA–PBS environment. d TIRF snapshots of a single cubosome fusion event between 1% DOTAP and 40% DOPS 30% CHOL within BSA–PBS environment. Scale bar 1.5 µm. e TIRF snapshots of a single cubosome fusion event between 1% DOTAP and 40% DOPS 30% CHOL within complete media environment. f Distribution of fusion times and fitted exponents for 1% DOTAP cubosomes with 40% DOPS 30% CHOL bilayer in BSA–PBS (Purple) and complete media (Teal)

