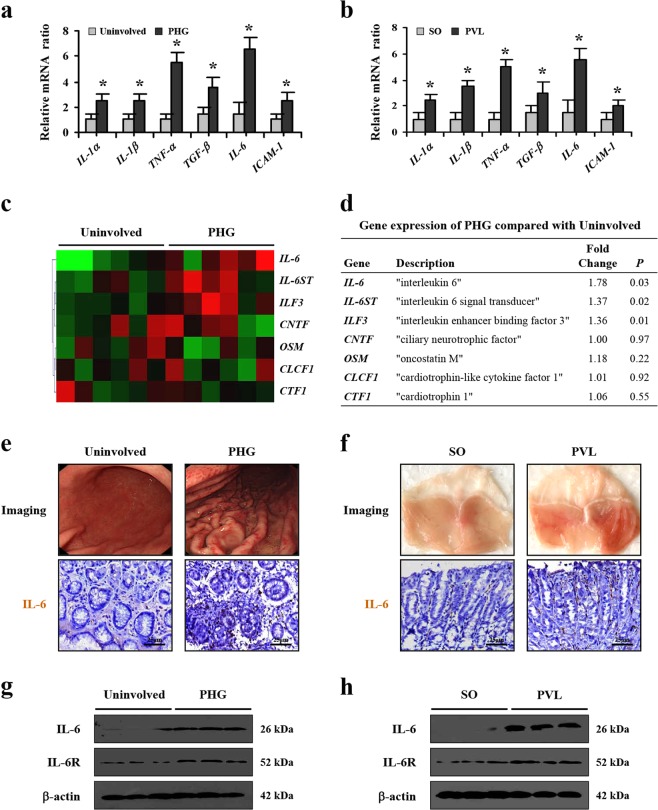
Fig. 1. IL-6 involved in PHG.
a, b Expressions of indicated inflammatory cytokines in the related gastric mucosa were analyzed. β-actin was used as an internal control. n = 6 in each group, values are presented as mean ± SEM. Bonferroni’s comparison post hoc test. *P < 0.05 versus uninvolved tissues or SO (sham operation) mice, respectively. c Two-dimensional hierarchical clustering results for the gene of IL-6 superfamily members between PHG patients and healthy volunteers (n = 6 per group). d The fold changes and P value of the indicated mRNA levels in PHG tissues relative to normal (uninvolved) tissues from microarray experiment were represented. e Endoscopic imaging and IL-6 immunohistochemistry (IHC) staining of uninvolved normal gastric mucosal tissue and gastropathic mucosal tissue from PHG patient were presented (brown, × 400, n = 6 per group). f IL-6 staining and gastric imaging in the indicated sections from SO and PVL mice (brown, × 400, n = 6 per group). g, h IL-6 and IL-6R levels in the indicated gastric mucosa were determined by western blotting in three pairs of different representative specimens. β-actin was used as the loading control. n = 6 per group

