
Fig. 1.
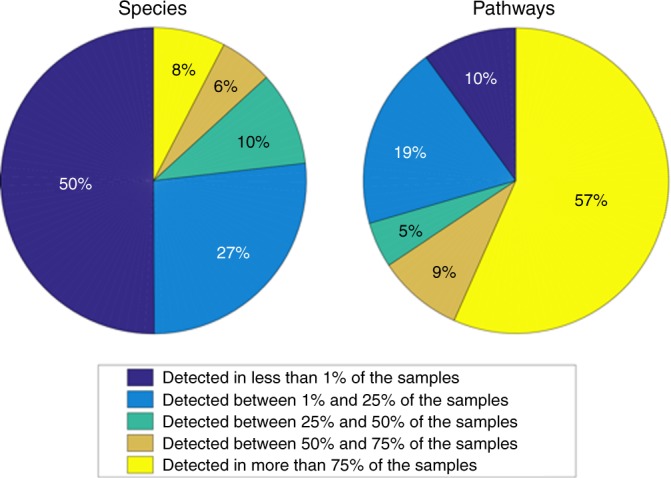
Gut microbiome composition. The composition of the gut ecosystem is unique to an individual while its functionality is maintained across the population. Pie charts represent the percentage of species (on the left) and microbial metabolic pathways (on the right) present in <1% of the population (dark blue), between 1% and 25% (light blue), between 25% and 50% (turquoise), between 50% and 75% (brown), and more than 75% (yellow)