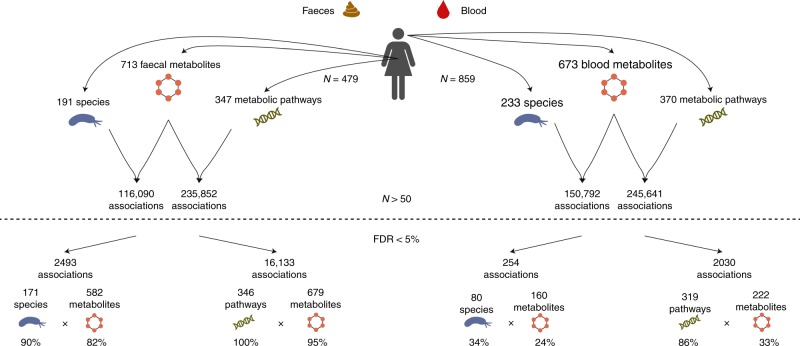
Fig. 2.
Study design and number of associations. The top of the figure reports the number of microbial species and metabolic pathways which were detected in at least 50 individuals with metabolomics and WMGS data, and that were used in the study, and the number of associations tested. The bottom of the figure reports the number of associations that were significant at a 5% FDR, along with the number and percentage of metabolites, microbial species, and microbial metabolic pathways involved. Association testing was performed using PopPAnTe12, in order to model the resemblance between family members. Sex and age at the sample collection were included as covariates

