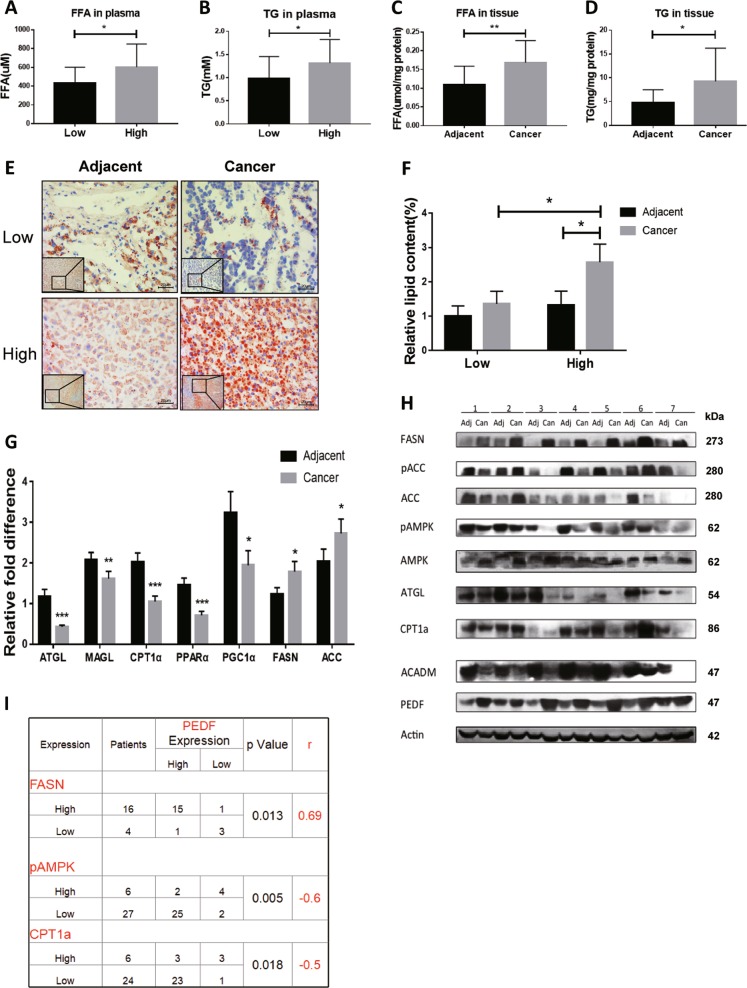
Fig. 4. The association between PEDF expression and lipid metabolism in HCC patients.
Plasma FFA levels (a, n = 33) and plasma TG levels (b, n = 46) were evaluated in HCC patients (Low, PEDF low-expressed HCC patients; High, PEDF high-expressed HCC patients). FFA levels and TG levels (c, d, n = 14) in PEDF high-expressed HCC tissues (Cancer) and matched adjacent non-tumor tissues (Adjacent) were evaluated. e Oil Red O staining was performed to determine lipid droplets in HCC tissues and matched adjacent non-tumor tissues. Representative images are shown (Low, PEDF low-expressed tissues; High, PEDF high-expressed tissues) and f relative lipid content was quantified using Image Pro Plus 6.0 (n = 3). g mRNA expression levels of lipid metabolic regulators in HCC tissues and matched adjacent non-tumor tissues were evaluated by qPCR analysis (ATGL: n = 45, MAGL: n = 43, CPT1α and PPARα: n = 30, PGC1α: n = 31, FASN and ACC-1: n = 23). h Protein expression levels of lipid metabolic enzymes in HCC tissues (Can) and matched adjacent non-tumor tissues (Adj) were evaluated by western blot analysis. i Correlation analysis between PEDF protein expression and FASN protein levels (n = 20), pAMPK protein levels (n = 33), and CPT1α protein levels (n = 30) in HCC patients. All data are presented as mean ± SD and *p < 0.05, **p < 0.01, and ***p < 0.001, respectively

