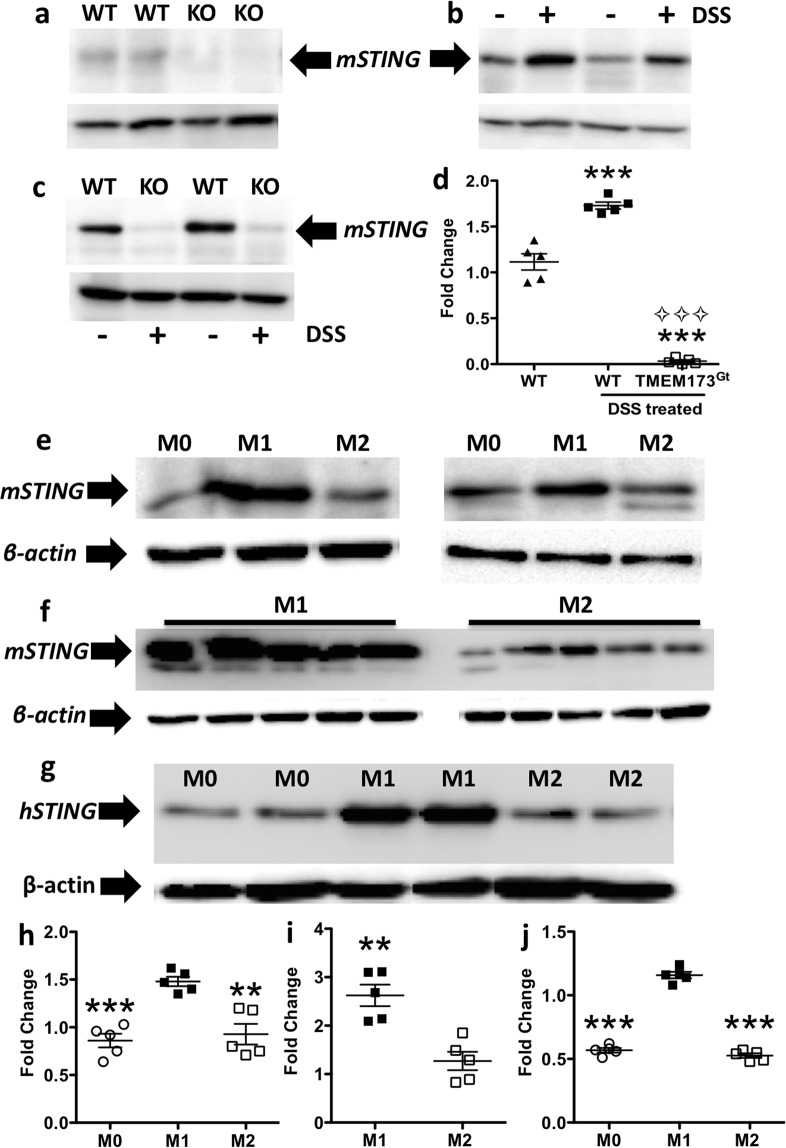
Figure 6.
Colitis and M1 polarization of murine and human macrophages increased STING protein expression. (a) A representative blot of STING expression from the colonic lysates of two untreated WT or Tmem173gt (KO) mice. (b–d) DSS-induced colitis increased STING protein expression in WT mice (+ = DSS treated) relative to that observed in both tap water treated control mice (− = tap water only) and STING deficient mice. One-way ANOVA followed by Tukey’s multiple comparisons post-hoc test between all groups was used. Values for (d) are means ± SEM, n = 5 mice per group, ***P < 0.001 relative to both the WT and Tmem173gt groups and ⟡⟡⟡P < 0.001 relative to DSS-treated WT mice. (c,h) Representative blots and a histogram from two mice to show that STING protein expression in murine BMDM lysates was increased in M1 polarized macrophages when compared to M2 polarized or M0 macrophages. (d) To confirm the previous finding in (c), BMDMs from 5 mice were polarized into M1 or M2 macrophages. (i) Again, there was a significant increase in mSTING expression in the M1 polarized macrophages relative to the expression levels found in the M2 cells. (g,j) This also occurred in human THP-1 monocytic cells as M1 polarization markedly increased STING protein expression. Immunoblots of polarized murine BMDMs: M0, untreated; M1, 50 ng/ml of LPS and IFNγ; M2, 40 ng/ml IL-4 for 48 hrs. 50 μg of protein/lane was loaded, and β-actin was used as the loading control for all immunoblot analyses. For (h,j) one-way ANOVA followed by Tukey’s multiple comparisons post-hoc test between all groups was used, n = 5, **P < 0.01 or ***P < 0.001 relative to M0 or M2; for (i), a Student’s T-test was applied with **P < 0.01 vs. M2.

