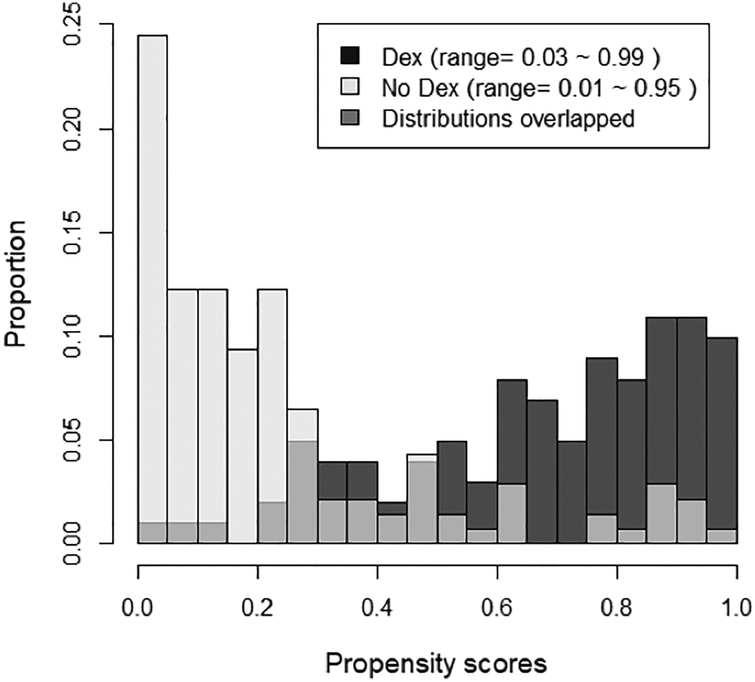
Figure 2.
Overlay histograms of propensity scores showing the regions of common and uncommon support between the propensity score distributions in the Dex and no-Dex groups. The lightest color is “No Dex,” the darkest color is “Dex” and the intermediate color represents the overlap between the two distributions.

