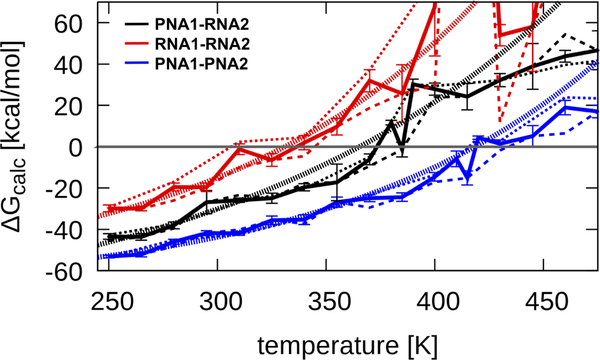
Figure 5:
Binding free energy ΔGcalc as a function of temperature extracted from MD simulations. Data from 200 ns and 1 μs simulations is shown as thin dashed lines, combined data with error bars is shown as a thick solid line. Exponential functions of the form a · ex/b + c that were fit to the data are indicated as thick dotted lines. Coefficients of the fitted functions are for PNA1-PNA2: a=2.364 kcal/mol, b=123.09 K, c=−70.80 kcal/mol; for PNA1-RNA2: a=9.2086 kcal/mol, b=160.295 K, c=−90.00 kcal/mol; and for RNA1-RNA2: a=4.425 kcal/mol, b=122.09 K, c=−66.64 kcal/mol. Error bars represent the standard errors of the mean.

