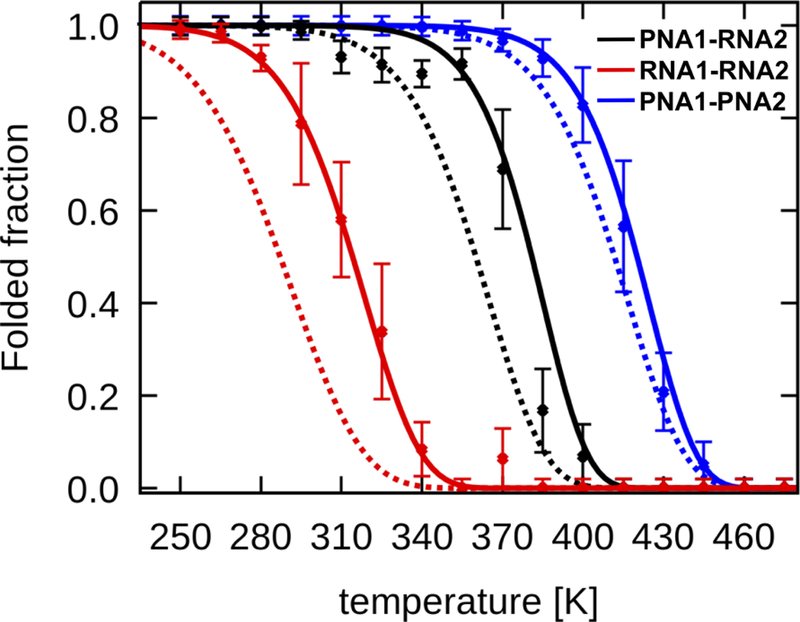
Figure 7:
Simulation melting profiles of the duplexes presented as the folded fraction versus temperature calculated based on MD trajectories, from 190 ns to 210 ns. Functions using Eq. 9 with the values in Table 2 are shown as dashed lines (fit only based on Eq. 6) and solid lines (fit based on Eqs. 6, 9, and 10, see text). Error bars represent the standard error of the mean.

