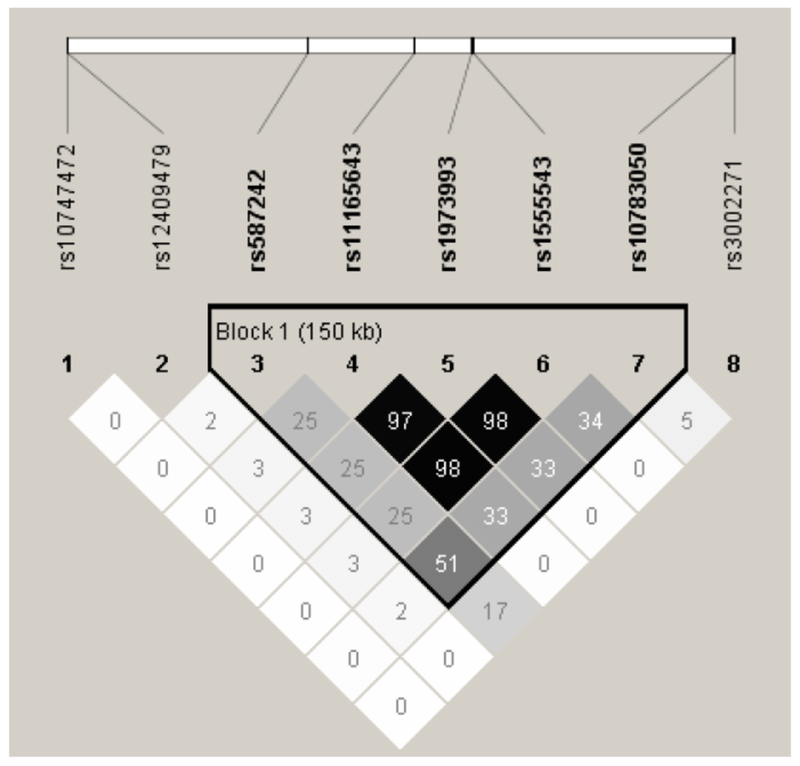
Figure 3. Linkage disequilibrium pattern between rs12409479 and previously identified SNPs.
A total of 7 SNPs were reported by previously GWAS meta-analyses of BMI and body weight (rs10783050, rs11165643, rs10747472, rs3002271, rs587242, rs1555543, rs1973993). Linkage disequilibrium (LD) pattern between each pair of these SNPs including rs12409479 and the LD r2 value are displayed with Haploview 53. Five SNPs are clustered into a single haplotype block spanning 150 kb. rs12409479 is in very low LD (r2=0.00-0.03) with any of the other SNPs, indicating that it is independent of all previous SNPs.

