
Figure 2. Group Differences in Frontostriatal rsFC.
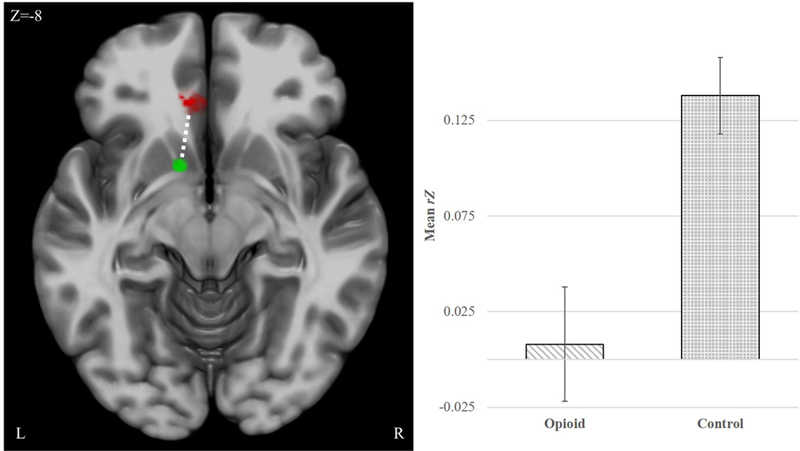
The opioid use group (OUG), relative to control group, evidenced weaker resting-state functional connectivity (rsFC) between the L.Nucleus Accumbens [NAc] (SEED; green sphere) and the L.ventromedial prefrontal cortex [vmPFC] (TARGET; red cluster). Error bars = +/− 1 SE of the mean. Note that the OUG connectivity within this pathway is not significantly different from zero.