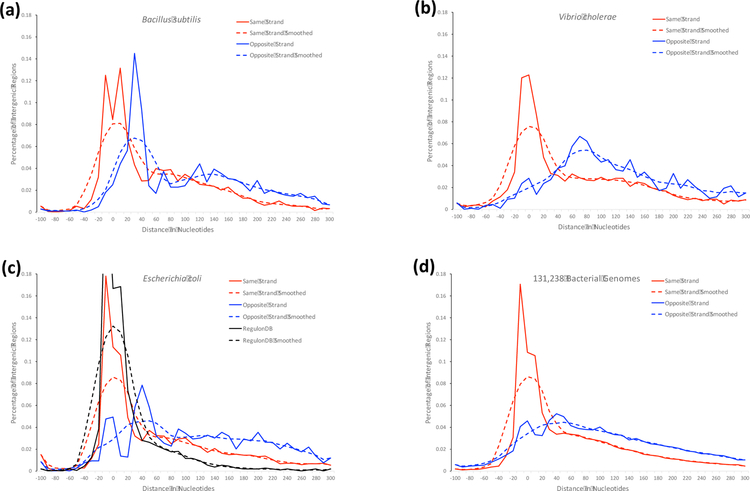
Figure 2.
The distribution of intergenic distances in nucleotides between consecutive genes on the same strand (solid red line) and between consecutive genes on the opposite strand (solid blue line) is shown for (a) Bacillus subtilis, (b) Vibrio cholerae, (c) Escherichia coli, and (d) 131,238 bacterial genomes. The Escherichia coli figure in (c) additionally shows the distribution of intergenic distances in nucleotides between consecutive genes that are part of documented operons in RegulonDB (solid black line) [31]. Dashed lines in the figures indicate smoothed versions of the distributions as determined with an Epanechnikov kernel.

