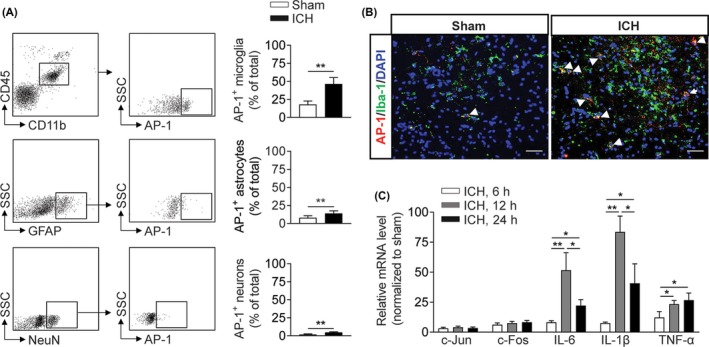
Figure 1.

Early upregulation of AP‐1 in the brain of ICH mice. A, Increased expression of AP‐1 in microglia, astrocytes, and neurons from sham and ICH mice. ICH mice were developed by autologous blood infusion. AP‐1 was analyzed by flow cytometry. n = 6 mice per group. B, Immunostaining images showing Iba 1+ cells (green) expressing AP‐1 (red) in groups of mouse brain sections harvested at 6 h after ICH or sham procedures. Scale bar: 40 μm. C, Bar graph shows mRNA expression of AP‐1 subunits (c‐Jun and c‐Fos) and inflammatory factors of brain tissues harvested at 6 h, 12 h, and 24 h after ICH or sham procedures in mice. n = 3 mice per group. Mean ± SEM. *P < .05; **P < .01
