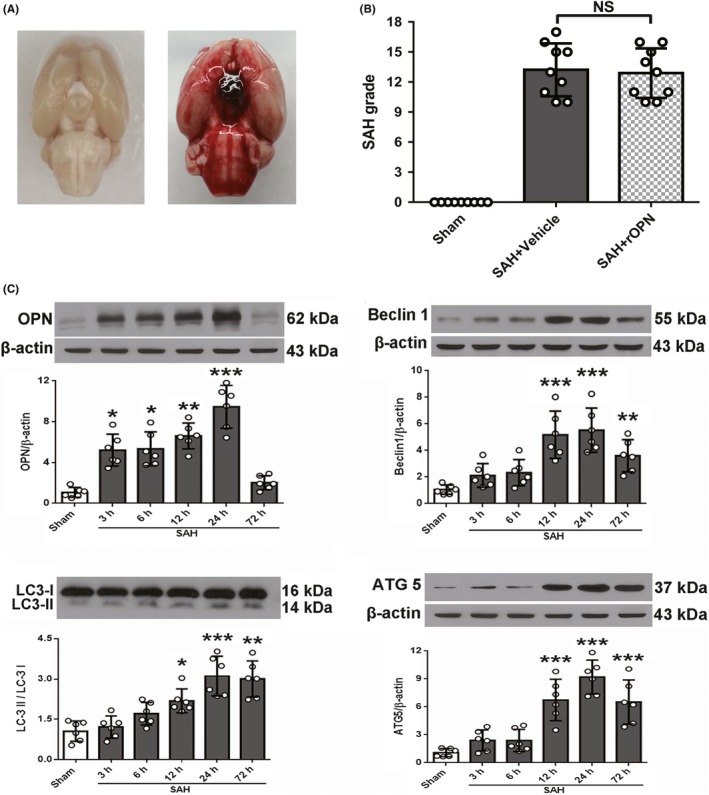
Figure 1.

Subarachnoid hemorrhage (SAH) grades and temporal expression of endogenous osteopontin (OPN) and autophagy‐related proteins in rat brain after SAH. A, Representative brain images of Sham and SAH rats. B, Summary of SAH grading scores of all groups. Sample size is 27, n = 9 per group. Data were analyzed using Kruskal‐Wallis test, χ 2 = 18.183. C, Representative Western blot images and quantitative analyses of OPN, Beclin 1, LC3, and ATG 5 from the left hemisphere of rat brains at different time points after SAH. Sample size is 36, n = 6 per group. Data were presented as mean ± SD. F = 28.45 for OPN, F = 12.37 for Beclin 1, F = 18.88 for LC3, F = 22.14 for ATG5. *P < .05, ** P < .01, ***P < .001 vs Sham group. SAH, subarachnoid hemorrhage; Vehicle, phosphate‐buffered saline; rOPN, recombinant OPN. NS, not significant
