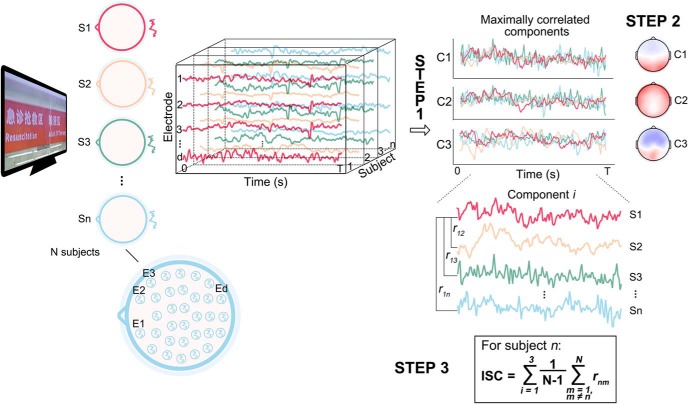
Figure 2.
Overview of the three-step ISC analysis. Neural responses are recorded on D electrodes from N subjects during the time (0–T s) of stimuli presentation. First, a few (first three in this study) maximally correlated components are extracted. Second, the spatial distribution of each component is visualized. Third, for each subject, ISC is measured as the sum of the averaged correlation coefficients between that subject and remaining subjects over the first three components. Ed, Electrode d; Sn, subject n. Ci, component i.

