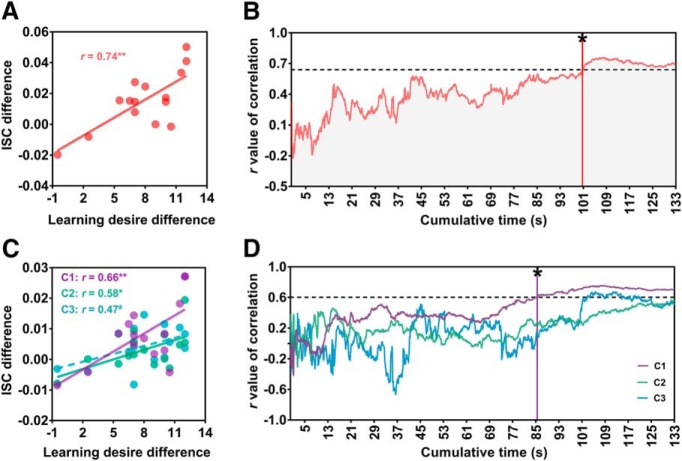
Figure 5.
ISC predicted course-learning desire. A, Pearson correlation indicated ISC difference (high vs low) positively associated with the subject’s learning desire difference (high vs low; r(15) = 0.74, p = 0.002). B, ISC difference became a significant correlate of learning desire difference after ∼100 s of watching. The vertical red line with an asterisk indicates the earliest time (100.6 s) at which such a correlation reached the significance. The horizontal dashed line indicates the correlation coefficient (r(15) = 0.64, p < 0.05, FDR corrected). C, Pearson correlations indicated differences in subcomponent ISCs independently associated with the subject’s learning desire difference. D, For C1, the vertical purple line with an asterisk indicates the earliest time (85.5 s) at which correlation reached the significance. The horizontal dashed line indicates the correlation coefficient (r(15) = 0.60, p < 0.05, FDR corrected). C2 or C3 showed no such early prediction effect. Each dot represents one subject. #p < 0.1, *p < 0.05, **p < 0.01.

