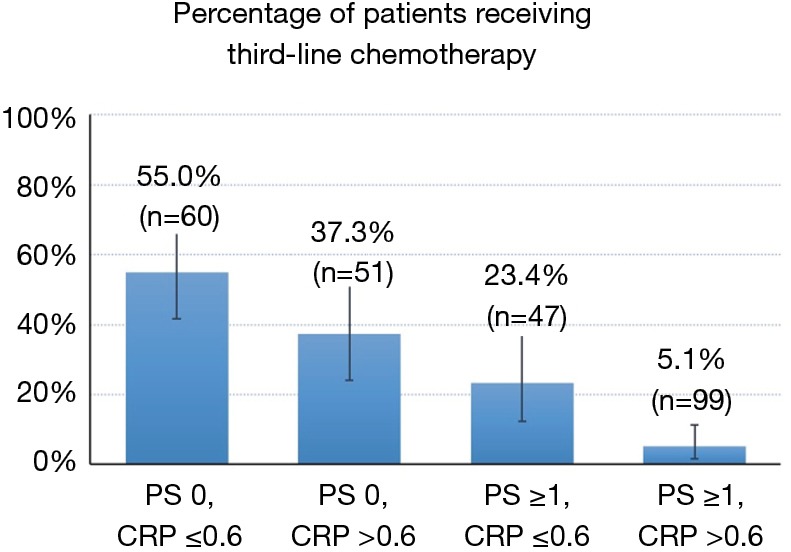
Figure 2.

The number and percentage of patients who received third-line chemotherapy, according to ECOG PS and serum CRP values. The bars represent the percentages of third-line chemotherapy received, and the whiskers represent 95% confidence intervals. ECOG, Eastern Cooperative Oncology Group; PS, performance status; CRP, C-reactive protein.
