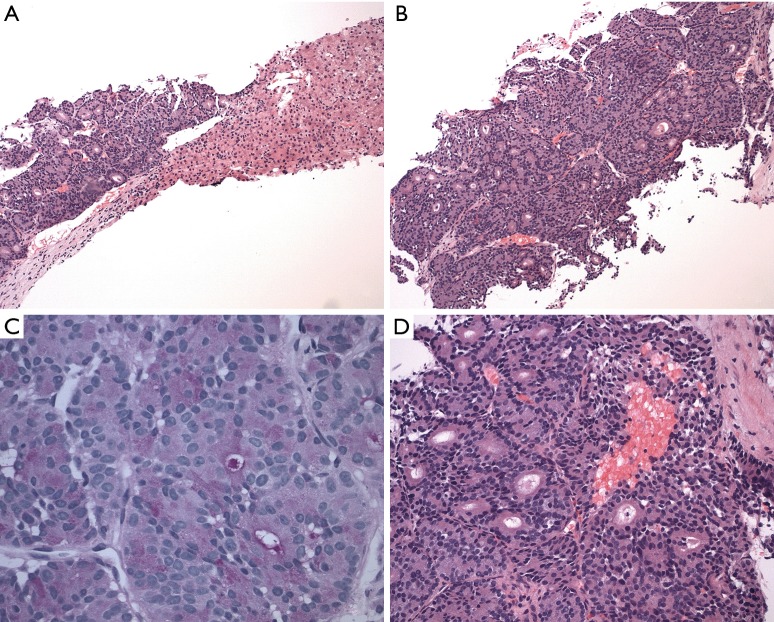
Figure 2.
Histology slides showing diagnostic immunohistochemical stains. (A) H&E showing tumor cells arranged in nested, glandular, and acinar patterns compared to normal hepatic cells (magnification ×40); (B) H&E stain showing monomorphic tumor cells with basally oriented nuclei and abundant eosinophilic, granular apical cytoplasm representing a low-grade tumor (magnification ×100); (C) positive PAS staining cytoplasmic granules (magnification ×200); (D) higher power (magnification ×200) H&E showing tumor cells with minimal stroma and desmoplastic response. PAS, Periodic acid-Schiff.

