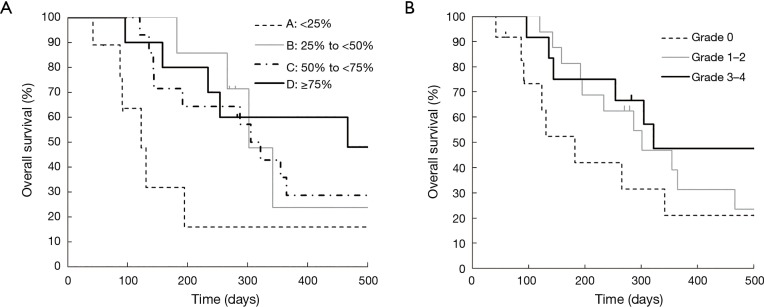
Figure 1.
Kaplan-Meier curves for overall survival according to (A) the percentage decrease of neutrophils during the first cycle of TAS-102 treatment in the four categories: Category A (<25%), B (25% to <50%), C (50% to <75%), D (≥75%), and (B) neutropenia based on the CTCAE during the first cycle of TAS-102 treatment in the three categories: Grade 0, Grade 1–2, Grade 3–4. (A) Overall survival according to the percentage decrease of neutrophils; (B) overall survival according to neutropenia based on the CTCAE grade. CTCAE, Common Terminology Criteria for Adverse Events.

