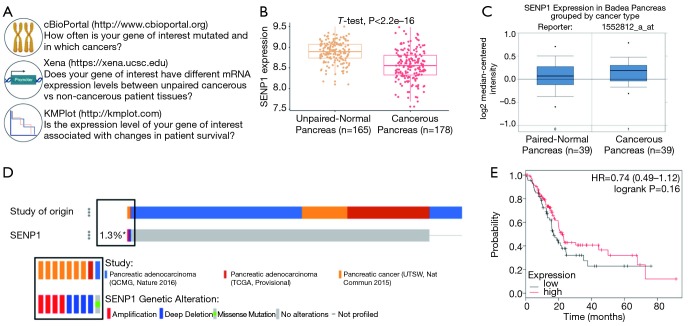
Figure 3.
Evaluation of SENP1 in pancreatic cancer patient samples using bioinformatics analyses. (A) Outline of bioinformatics resources used for SENP1 analysis; (B) quantitation of SENP1 mRNA expression from cancerous and unpaired non-cancerous pancreas tissue using data from the UCSC Xena Public Data Hub; (C) SENP1 mRNA expression levels in paired-normal pancreas tissue as compared to cancer tissue samples using Oncomine; (D) Oncoprint of SENP1 gene alterations in 676 patient samples using cBioPortal; (E) Kaplan-Meier survival analysis of 261 patients with high versus low SENP1 expression analyzed using KMPlot.com. Hazard ratio (HR), 95% confidence intervals, and logrank P value presented in the graph.

