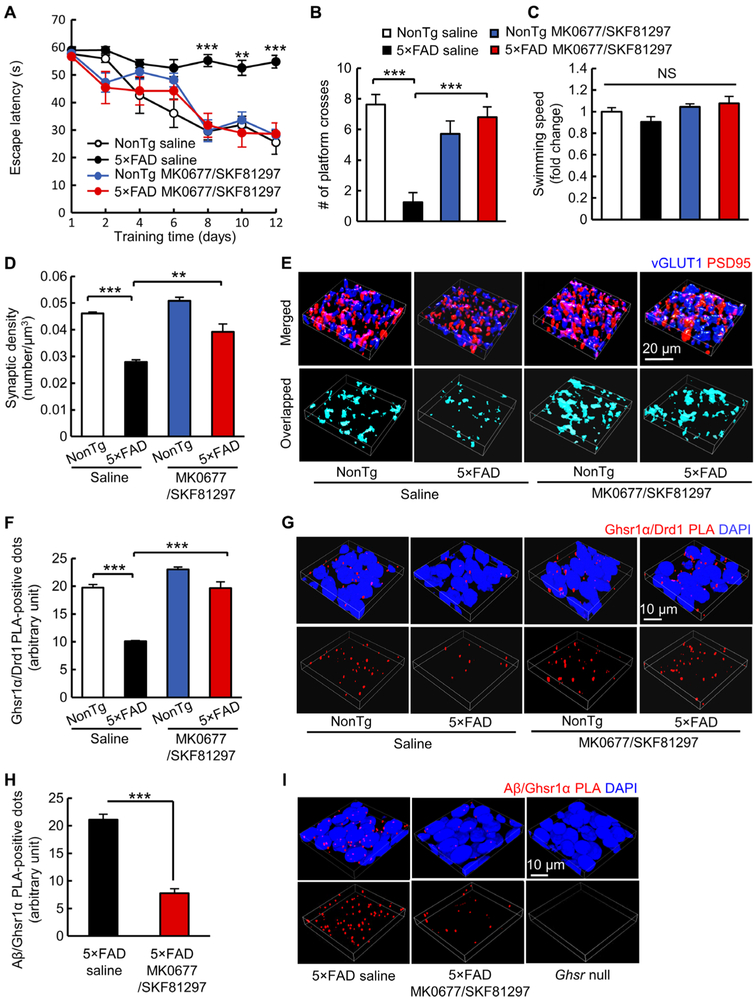
Fig. 6. Combined Ghsr1α/Drd1 activation protects hippocampal synapse and cognition in vivo.
(A to C) Spatial navigation analysis in four groups of mice treated with vehicle (saline) or MK0677/SKF81297 (MK0677, 1 mg/kg and SKF81297, 1.5 mg/kg) performing the Morris water maze test. (A) Spatial learning. **P < 0.01 and ***P < 0.001 5×FAD saline versus other groups, two-way ANOVA followed by Bonferroni post hoc analysis. (B) Spatial reference memory. ***P < 0.001 5×FAD saline versus other groups, two-way ANOVA followed by Bonferroni post hoc analysis. (C) Swimming speed. nonTg saline, n = 8; 5×FAD saline, n = 8; nonTg MK0677/SKF81297, n = 7; and 5×FAD MK0677/SKF81297, n = 5. (D and E) Analysis of synaptic density in the hippocampal CA1 region. **P < 0.01 and ***P < 0.001 5×FAD saline versus other groups, two-way ANOVA followed by Bonferroni post hoc analysis. nonTg saline, n = 3; 5×FAD saline, n = 4; nonTg MK0677/SKF81297, n = 4; and 5×FAD MK0677/SKF81297, n = 4. (E) Representative 3D reconstructed images of synapse staining in the CA1 region. vGLUT1 (blue) and PSD95 (red) were used to visualize pre- and postsynaptic components, respectively. The overlaid staining of vGLUT1 and PSD95 indicates synapses. (F and G) Analysis of Ghsr1α/Drd1 complex in the CA1 region. ***P < 0.001 5×FAD saline versus other groups, two-way ANOVA followed by Bonferroni post hoc analysis. n = 4 per group. (G) Representative 3D reconstructed images of Ghsr1α/Drd1 PLA-positive dots (red). Nuclei were stained with DAPI. (H and I) Analysis of Aβ/Ghsr1α PLA-positive dots in CA1 region. ***P < 0.001, unpaired Student’s t test. n = 4 per group. (I) Representative 3D reconstructed images of Aβ/Ghsr1α PLA dots (red). Nuclei were stained with DAPI.

