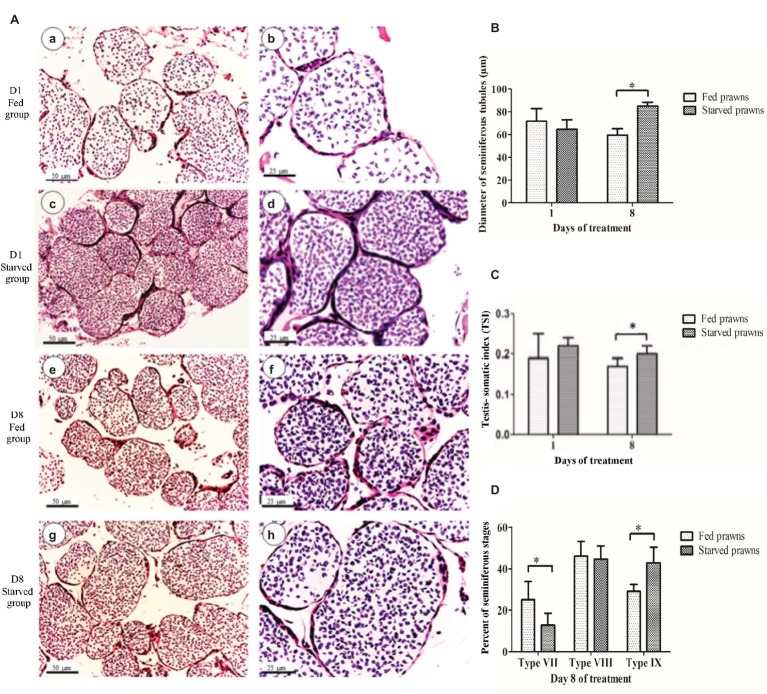
Figure 1.
The effect of starvation on testes at days 1 and 8 as indicated by testicular histology (A), testis-somatic index (GSI) (B), mean diameters of seminiferous tubules (DST) (C) and maturation of seminiferous stages (D). (A) Light micrographs showing seminiferous tubules in testes (H&E staining) at day 1 of fed prawns (a and b) and starved prawns (c and d), and at day 8 of fed prawns (e and f) and starved prawns (g and h). (B) Histograms showing testis-somatic index (TSI) of fed and starved prawns. (C) Diameters of seminiferous tubules (DST) in testes of starved and fed prawns at days 1 and 8. (D) At day 8, the testes of fed prawns showed more seminiferous tubules at middle stage VII than starved prawns, while the latter showed more seminiferous tubules at terminal stages IX. Asterisk indicates significant difference (p < 0.05) between the two groups (n = 5).

