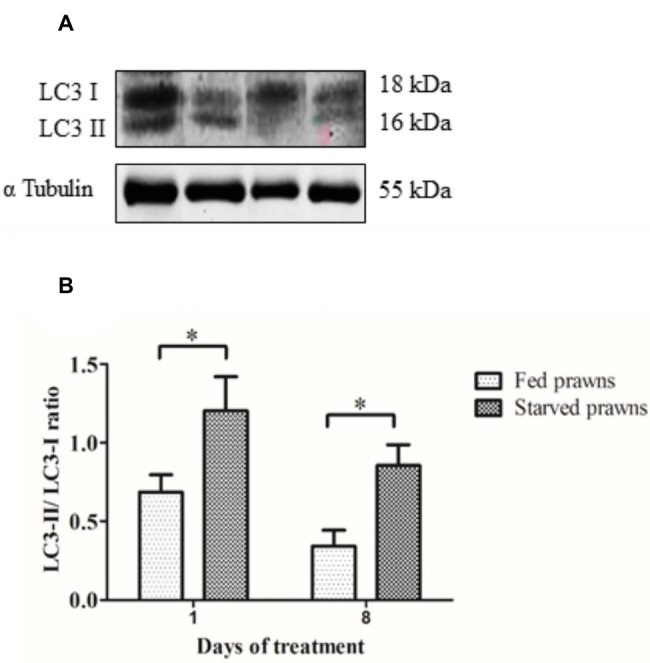
Figure 4.

The effect of starvation on the expression of autophagy markers in the testes. (A) Immunoreactivity of testes from fed and starved prawns at days 1 and 8 showed bands of LC3-I and II as probed by anti- LC3. Immunoblots of α tubulin was used as a control. (B) The ratio of LC3-II to LC3-I intensity was increased in the testicular extracts from starved prawns (S) when compared to those of the fed (F) prawns at both days 1 and 8. Asterisks indicate significant difference (p < 0.05) between the two groups (n = 5).
