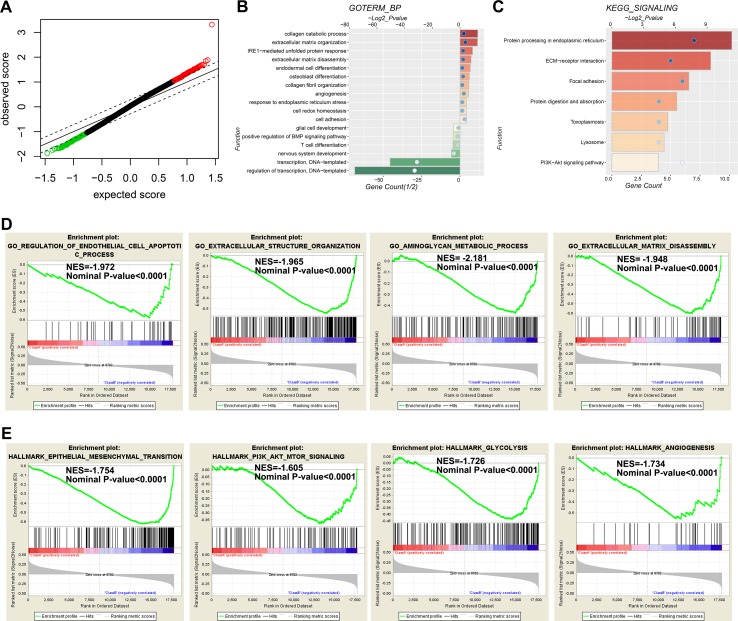
Figure 5.
Functional annotation for genes differentially expressed between low- and high-risk groups. (A) The differential genes between low- and high-risk groups are shown by green (enriched in the low-risk group) and red (enriched in the high-risk group) dots. (B–C) Go analysis (B) and KEGG analysis (C) are used to evaluate differential genes between low-and high-risk groups. (D and E) GSEA analysis reveals the biological processes (D) and cancer hallmarks (E) enriched in the high-risk groups.

