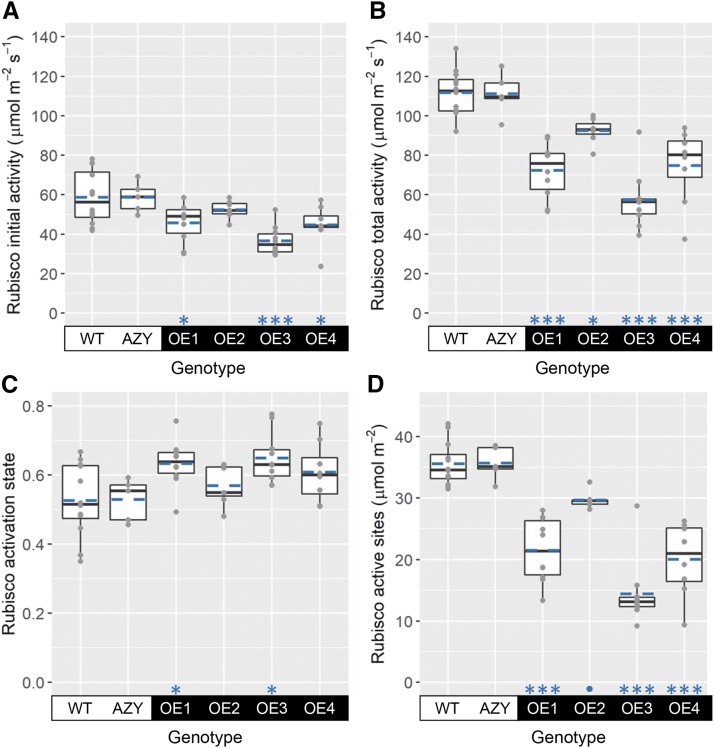
Figure 3.
Rubisco activities, activation state, and quantity of active sites. Plots show Rubisco initial (A) and total (B) activities, Rubisco activation state (C), and Rubisco active site content (D) in flag leaves of wheat wild-type plants (WT), negative controls (AZY), and transgenic lines overexpressing ca1pase (OE1–OE4). Boxes represent the median and first and third quartiles, whiskers represent the range, symbols represent individual samples, and dashed blue lines represent the mean (n = 5–12 biological replicates). There was a significant effect of genotype on Rubisco initial activity (ANOVA, P < 0.001), total activity (ANOVA, P < 0.001), activation state (ANOVA, P < 0.01), and active site content (ANOVA, P < 0.001). Significant differences between each OE line and the wild type are denoted as •P ≤ 0.1, *P ≤ 0.05, **P ≤ 0.01, and ***P ≤ 0.001 (Tukey’s HSD test).

