Figure 3.
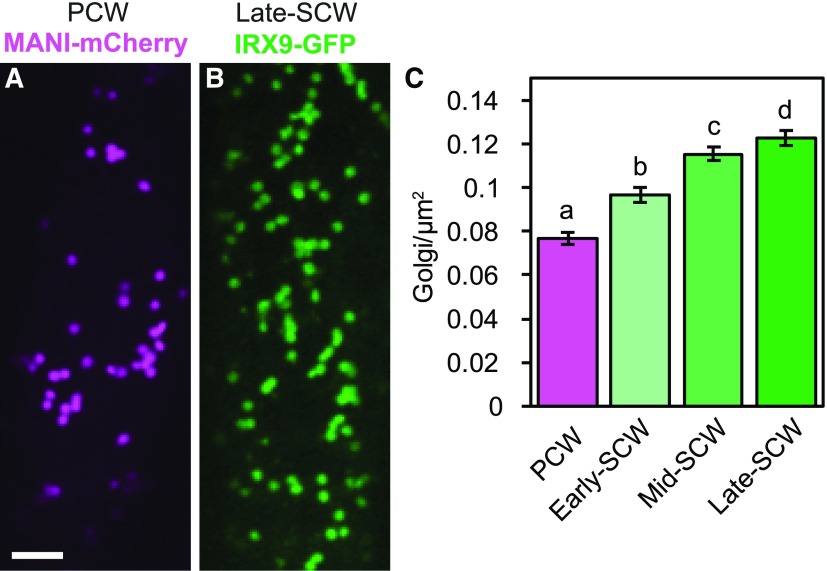
IRX9-GFP-labeled Golgi increase in density as SCW deposition progresses. A and B, Golgi in the cell cortex in a PCW-producing cell with the Golgi marker proUBQ10:MANI-mCherry (A) or a late-SCW cell expressing proIRX9:IRX9-GFP (B). Scale bar = 5 μm. C, Quantification of Golgi density in the cell cortex before SCW deposition (PCW) and at early, mid, and late stages of SCW deposition. Means ± 95% CI. Different letters (a to d) indicate statistically significant differences. Statistics = one-way ANOVA and Tukey HSD post hoc test (P < 0.05). For each stage n = 223–342 cells from 31 to 78 plants in 4–6 replicate confocal experiments.

