Figure 3.
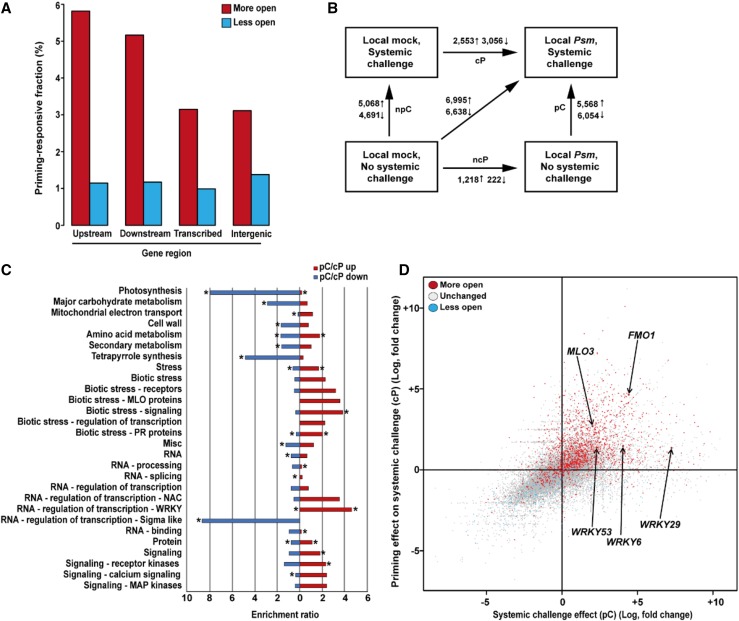
Identification of regulators of defense priming. A, In systemic leaves of Local Psm plants, priming is associated with formation of more open (red columns) and less open (blue columns) chromatin sites in different regions of the Arabidopsis genome. The diagram gives the proportion numbers given in Supplemental Table S1. The numerator is the number of regions with a given classification (upstream, downstream, transcribed, or intergenic), which are more open or less open. The denominator is the number of regions with the same classification in the entire genome. B, Changes in gene expression upon the indicated treatments. ↑, number of induced genes; ↓ number of repressed genes. C, Shown are top-level MapMan bins that were significantly enriched (red) or depleted (blue) in the pC/cP comparison and selected leaf bins that showed at least 2-fold enrichment in the categories “stress", “RNA”, and “signaling". *P ≤ 0.05. D, Relationship between chromatin state (more open, unchanged, or less open) and transcriptional response of genes. The chromatin state (determined by FAIRE-seq) in unchallenged systemic leaves of Local Psm plants was compared to that of unchallenged systemic leaves of Local mock plants. Chromatin state is indicated by color. The transcriptional response of genes (determined by RNA-seq) in challenged systemic leaves of Local Psm plants at 2.5 h after the systemic challenge was compared to that of challenged systemic leaves of Local mock plants (on the y axis) and to that of unchallenged systemic leaves of Local Psm plants (on the x axis). We used the response of all 24,447 genes, which we detected in any RNA-seq experiment, to compose this chart. MLO3, mildew resistance locus O3; FMO1, flavin monooxygenase 1; pC, effect of systemic challenge on priming; cP, effect of priming on systemic challenge.

