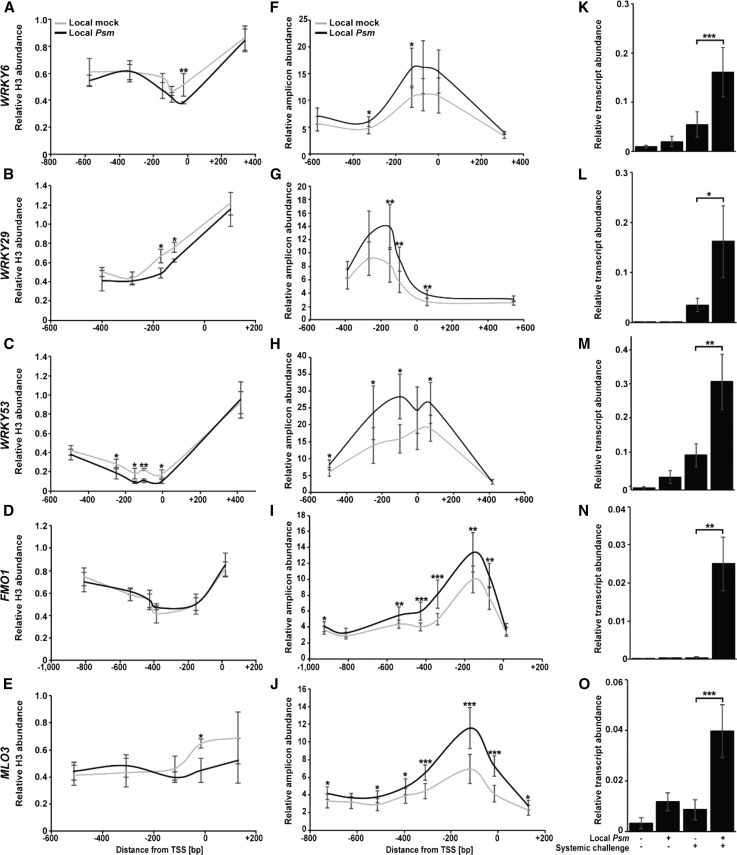
Figure 5.
Reduction of histone H3, formation of open chromatin, and enhanced responsiveness of defense genes in systemic leaves of Local Psm plants. A to E, Reduction of H3 in the 5′ leader sequence and near the TSS of defense genes in untreated systemic leaves of Local mock and Local Psm plants. Error bars represent the SD (n = 6). F to J, Formation of more open chromatin in the same region and in similarly treated plants. Error bars represent the SD (n ≥ 3). K to O, Gene expression upon systemic challenge (+) of Local mock (− Local Psm) and Local Psm (+ Local Psm) plants. Error bars represent the SD (n ≥ 4). ***P ≤ 0.001; **P ≤ 0.01; *P ≤ 0.05.

