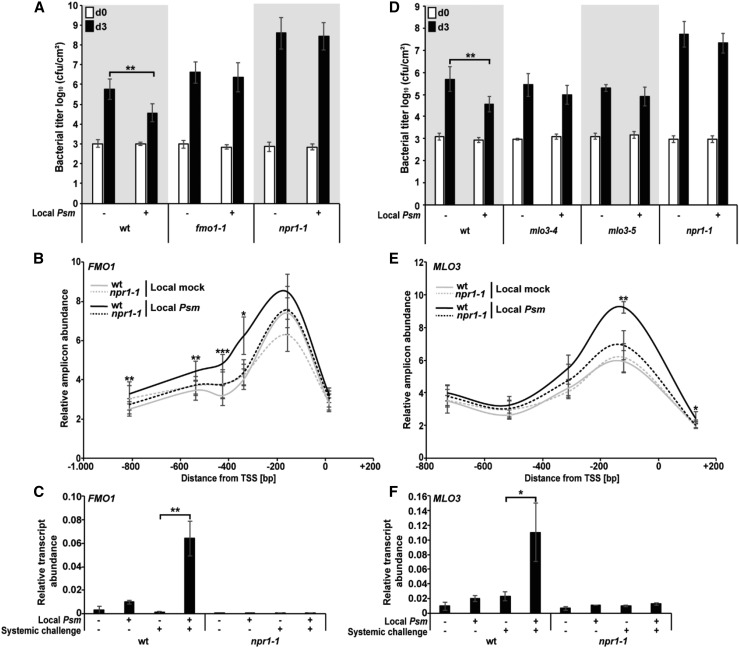
Figure 6.
Attenuated SAR in fmo1, npr1, and mlo3 and absence of open chromatin and primed FMO1 and MLO3 expression in npr1. A and D, SAR bioassay in wild type (wt) and the fmo1, npr1, and mlo3 mutants. Error bars represent the SD (n = 5). B and E, Reduced promoter opening in systemic leaves of the npr1 mutant upon local mock or local Psm infection. Error bars represent the SD (n = 3). C and F, Absence of primed FMO1 and MLO3 expression in systemic leaves of locally Psm-inoculated npr1 plants. Error bars represent the SD (n = 4). Cfu, colony-forming units; d0, bacterial titer immediately after Psm inoculation (day 0); d3, bacterial titer at 3 d post Psm inoculation; ***P ≤ 0.001; **P ≤ 0.01; *P ≤ 0.05.

