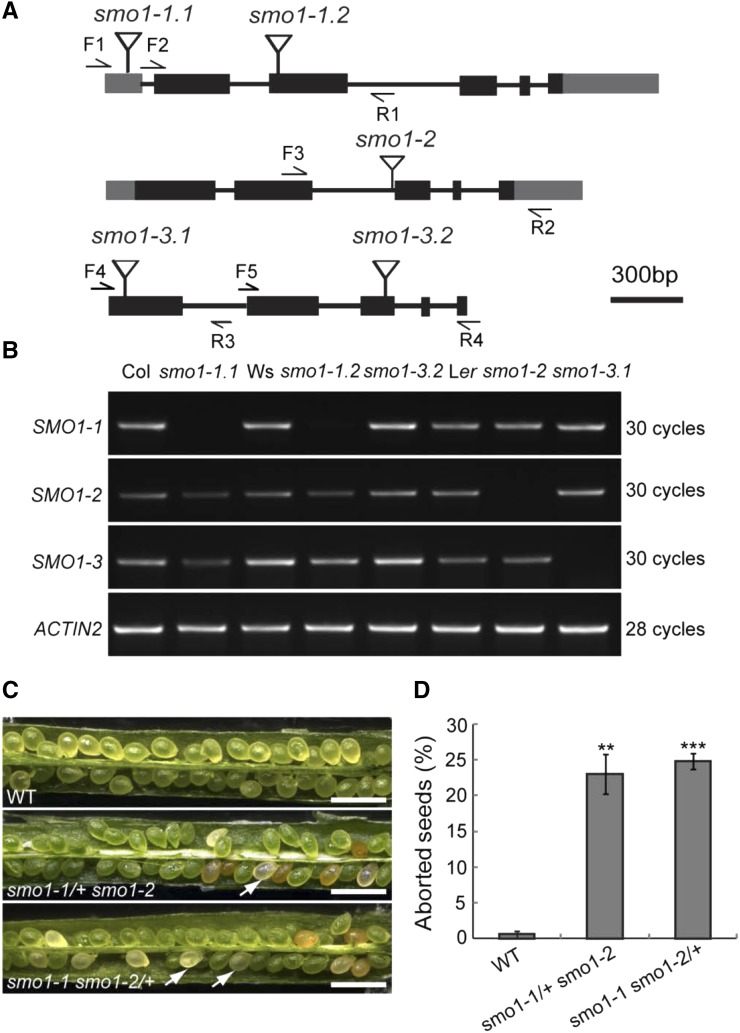
Figure 2.
Expression and phenotypic analyses of T-DNA insertion mutants of SMO1 genes. A, Structures of SMO1 genes with the T-DNA insertion sites. Gray boxes indicate 5′ and 3′ untranslated region, dark boxes indicate coding regions, lines indicate introns, and flags indicate T-DNA insertion site. F, Forward primer; R, reverse primer. B, Transcript levels of SMO1-1, SMO1-2, and SMO1-3 genes in wild-type and T-DNA insertion mutants. ACTIN2 gene was used as an internal control. Col, ecotype Columbia of Arabidopsis; Ler, ecotype Landsberg erecta of Arabidopsis; Ws, ecotype Wassilewskija of Arabidopsis. C, Eight-DPA siliques of wild-type (WT), smo1-1/+ smo1-2, and smo1-1 smo1-2/+ mutants. Arrows indicate aborted seeds. Bars = 1 mm. D, Percentage of aborted seeds in dissected siliques of wild-type, smo1-1/+ smo1-2, and smo1-1 smo1-2/+ mutants. Values are means ± sd of three independent experiments (n = 10 siliques from 5 plants for each experiment). Significant differences were analyzed using Student’s t test (one-tailed, two-sample equal variance; **P < 0.01; ***P < 0.001).

