Figure 6.
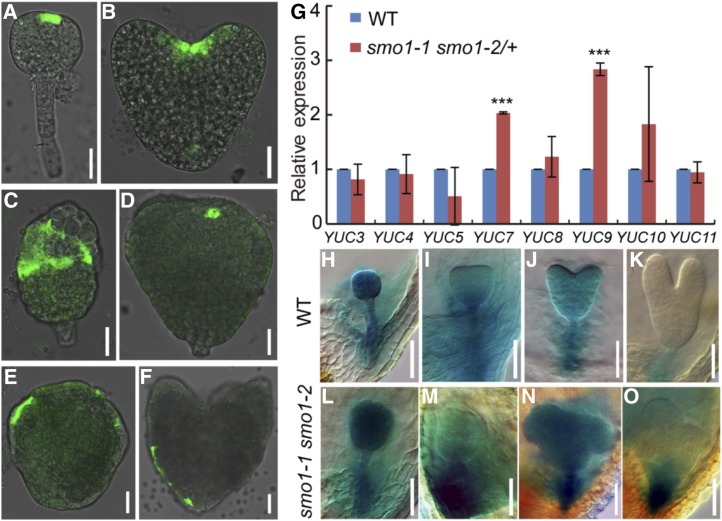
Expression analyses of TAA1 and YUC genes in wild-type (WT) and putative smo1-1 smo1-2 embryos. A and B, Expression patterns of ProTAA1:GFP-TAA1 in wild-type embryos at globular (A) and heart (B) stages. C to F, Expression patterns of ProTAA1:GFP-TAA1 in putative smo1-1 smo1-2 embryos. G, Relative transcript levels of YUC genes in early developing seeds dissected from 1- to 3-DPA siliques. The expression levels were normalized to that of TAP42 INTERACTING PROTEIN OF 41 KDA (TIP41). Values are means ± sd of three independent experiments. For each experiment, approximately 0.05 g of seeds dissected from 1- to 3-DPA siliques of wild-type and smo1-1 smo1-2/+ mutant, respectively, was used to extract total RNA, 1 μg of total RNA was reverse transcribed into cDNA, 1 μL of each cDNA sample was mixed with 7.5 µL of SYBR Green Real-Time PCR Master Mix (DBI Bioscience) and then analyzed by reverse-transcription quantitative PCR (RT-qPCR). Significant differences were analyzed using Student’s t test (one-tailed, two-sample equal variance; ***P < 0.001). H to K, Expression patterns of ProYUC9:GUS in wild-type embryos at globular (H), triangular (I), heart (J), and torpedo (K) stages. L to O, Expression patterns of ProYUC9:GUS in putative smo1-1 smo1-2 embryos. Bars = 25 μm (A–F) and 50 μm (H–O).

