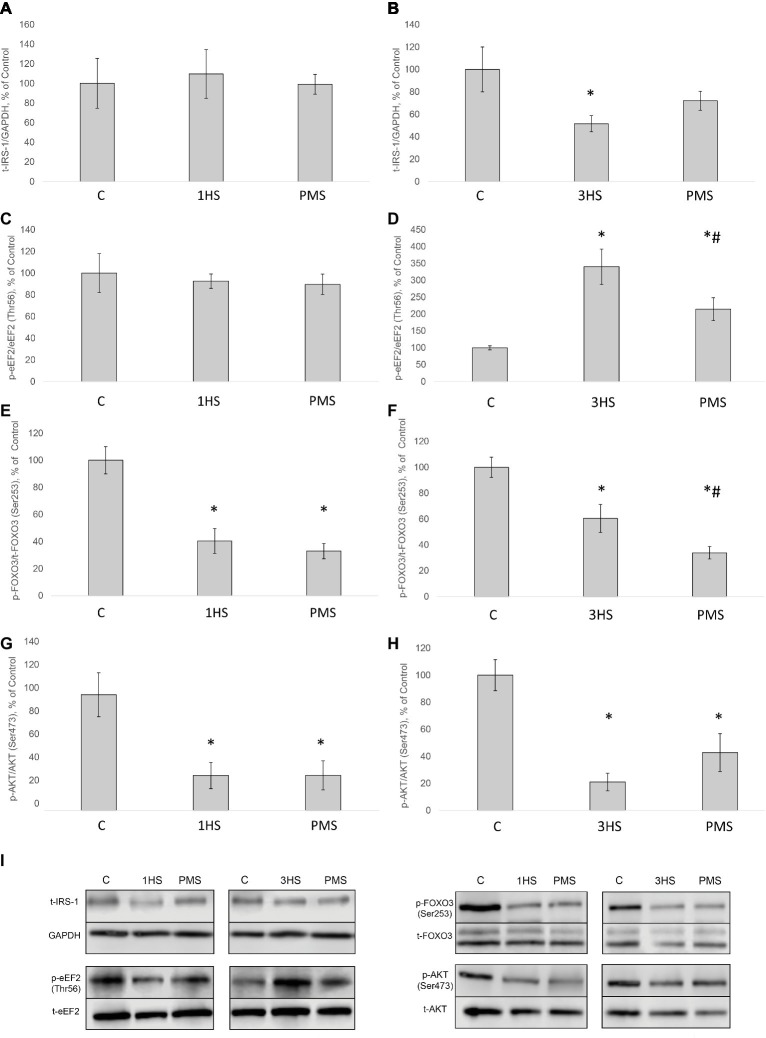
Figure 2.
Phosphorylation status of the signaling proteins in the rat soleus muscle after hindlimb suspension and plantar mechanical stimulation. Quantification of total IRS-1/GAPDH ratio after 1-day HS (A) and 3-day HS (B). Quantification of phospho-eEF2/total eEF2 ratio after 1-day HS (C) and 3-day HS (D). Quantification of phospho-FOXO3/total FOXO3 ratio after 1-day HS (E) and 3-day HS (F). Quantification of phospho-AKT/total AKT after 1-day HS (G) and 3-day HS (H). Representative immunoblots for the studied proteins in the rat soleus muscle (I). C, control group; 1HS, 1-day hindlimb suspension; 3HS, 3-day hindlimb suspension; PMS, 1- or 3-day HS plus plantar mechanical stimulation. All data expressed relative (%) to control. *Significant difference vs. C, p < 0.05; #significant difference vs. HS. All values are means ± SE, n = 7/group.

