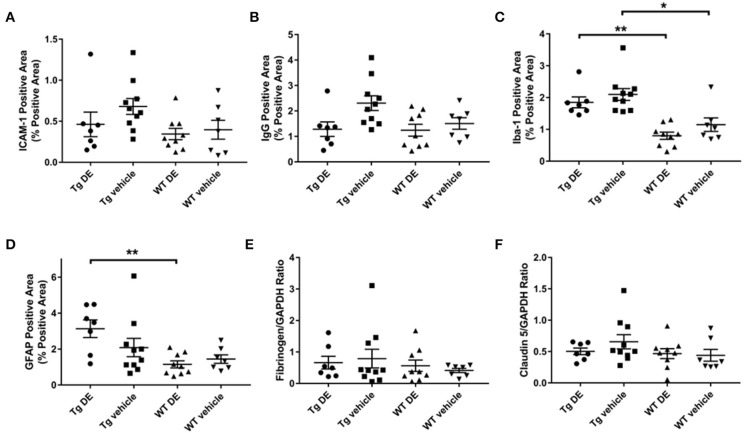
Figure 4.
Immunohistochemical (A–D) and Western blot analysis (E–F) of endothelial activation (A), blood-brain barrier structure and function (B,E,F), and neuroinflammation (C,D) in Tg2576 and WT mice with/without DE. Significant difference in Iba-1- (C) and GFAP-positive (D) area of DE-treated Tg2576 mice and WT littermates and in Iba-1-positive area of vehicle-treated Tg2576 mice and WT littermates. Statistical tests: Kruskal-Wallis test followed by Dunn's multiple comparison tests. Individual data points are presented with mean and SEM error bars. *Indicates significant difference between means, p < 0.05. **Indicates significant difference between means, p < 0.01.

