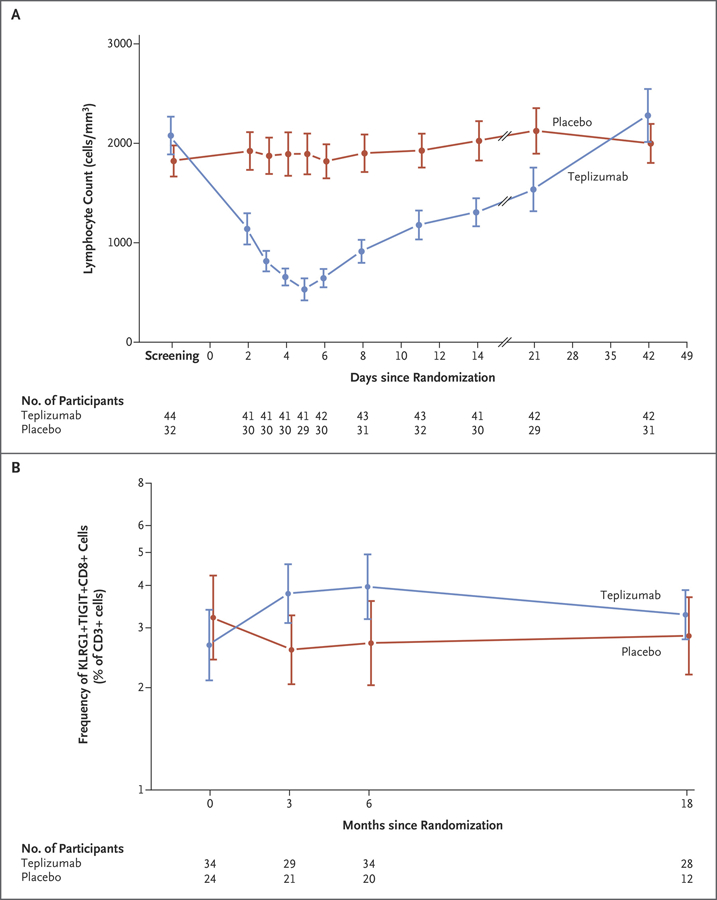
Figure 2. Changes in T-Cell Subsets in the Treatment Groups.

Panel A shows the absolute lymphocyte counts in the treatment groups over the first 7 weeks after enrollment. Panel B shows the frequency of KLRG1+TIGIT+CD8+ T cells as a percentage of total CD3+ T cells in the teplizumab and placebo groups. The estimates of the percentage differences between the teplizumab group and the placebo group are 46.5% at 3 months (95% CI, 8.23 to 98.4), 49% at 6 months (95% CI, 4.13 to 113), and 15.9% at 18 months (95% CI, −14.2 to 56.4). The analysis was performed with log-transformed values by analysis of covariance and corrected for the baseline values. In both panels, means and 95% confidence intervals are shown.
