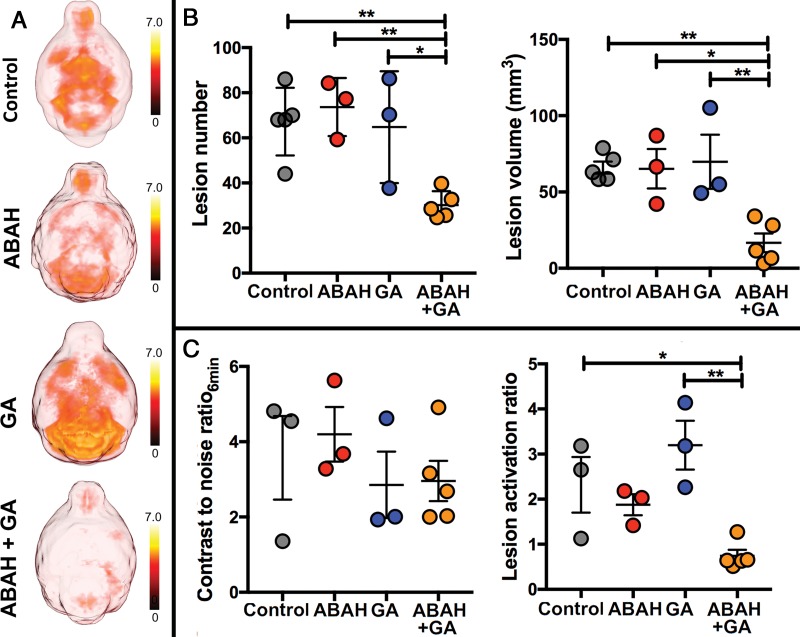
Figure 2:
Images show myeloperoxidase (MPO)-specific MRI of treatment effect. A, Representative three-dimensional maps of 90-minute bis-5-hydroxytryptamide-diethylenetriaminepentaacetate gadolinium (hereafter, MPO-Gd) contrast-to-noise ratios (CNRs) over entire brain (axial view) show overall disease burden for each group. B, Average lesion number and lesion volume (on day 10, the acute exacerbation period; n = 5 in control group, n = 3 in single therapy group, n = 5 in combination therapy group). C, Early CNRs at 6 minutes after MPO-Gd injection (n = 3 in control group, n = 3 in single therapy group, n = 5 in combination therapy group) and MPO-specific lesion activation ratios (n = 3 in control group, n = 3 in single therapy group, n = 5 in combination therapy group). Swiss Jim Lambert mice (8–10 weeks old, female; National Cancer Institute, Frederick, Md). ABAH = 4-aminobenzoic acid hydrazide, GA = glatiramer acetate. * = P < .05, ** = P < .01.

