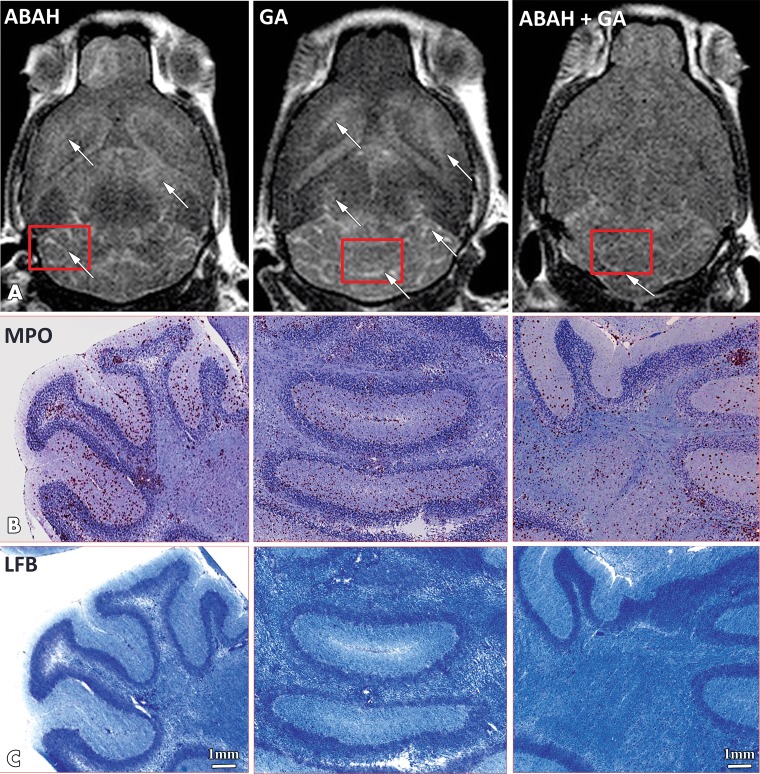
Figure 3:
Images show correlation of myeloperoxidase (MPO)-specific MRI with histopathologic analysis for MPO and demyelination. A, Representative late (90-minute) brain MRI (axial plane) for MPO-specific enhancing lesions (white arrow) throughout brain in suboptimally treated mice with 4-aminobenzoic acid hydrazide (ABAH), glatiramer acetate (GA), or combination therapy. Corresponding histopathologic slices (red rectangles) of, B, MPO immunostaining and, C, myelination (luxol fast blue [LFB]; blue areas represent intact myelin and white areas are demyelinated) in mice treated with ABAH, GA, or combination therapy. Scale bar = 1 mm; original magnification, ×1.25. Swiss Jim Lambert mice (8–10 weeks old, female; National Cancer Institute, Frederick, Md).

